


The post Bitcoin Price Is Trapped in a Liquidity Sandwich—Here’s What Happens Next appeared first on Coinpedia Fintech News
Bitcoin price has traded in a noticeably tighter range over the past day, hovering between $92,500 and $93,800 after failing to extend its early-week push above the $95,000 mark. Momentum has cooled, volatility has compressed, and intraday moves have become increasingly muted—a pattern that often signals that the market is waiting for a catalyst. But beneath the calm surface, heatmap data shows something far more active: liquidity is quietly building on both sides of the price. And that setup is rarely neutral, raising curiosity about what could happen next.
Bitcoin Price Coils Between Two Heavy Liquidity Zones
Bitcoin has spent much of the past 12 hours pinned in a narrow band around $93,000, as large pockets of liquidity accumulate above and below the current price. According to Coinglass liquidation data, BTC price is effectively sitting in the middle of a “liquidity sandwich”—a market structure where price gets trapped between two major liquidation magnets.
This setup often marks the calm before a directional surge. Traders are crowding key levels, liquidity is thickening, and volatility has started to compress—a combination that rarely lasts for long.
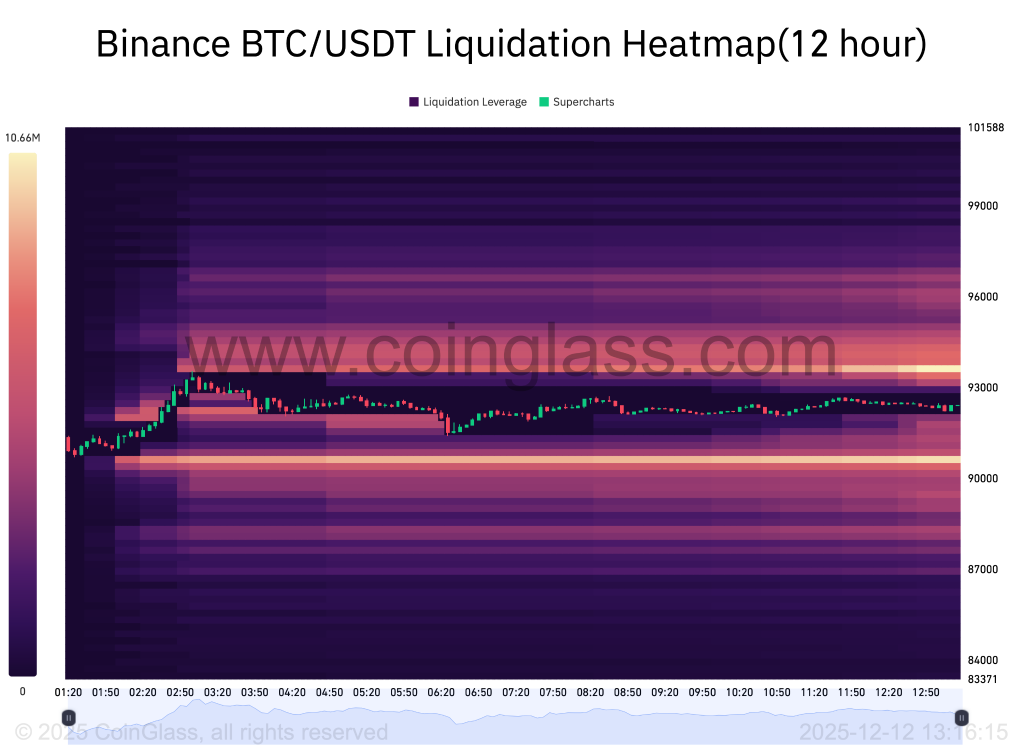
The latest 12-hour liquidation heatmap reveals several important details:
- Strong long liquidation clusters above $94.5K –$95K
- Heavy short liquidation liquidity sits below $90K–$91K.
- Spot price has drifted sideways with increasingly tight candles
- Large bands of resting orders surround the range, hinting at a liquidity sweep ahead
In simple terms, the Bitcoin price is boxed in. Market makers and large traders often exploit these pockets of liquidity, sweeping one side before reversing into the true direction.
Liquidity-driven setups like this are significant because they reveal where leveraged traders have placed their bets. When liquidity builds on both sides of the range, it creates a pressure cooker. The first sweep often triggers a cascade of liquidations—opening the door for a fast move in the opposite direction.
This dynamic is especially visible when volatility compresses, as it has over the last few sessions. BTC’s tight structure suggests traders should expect an expansion in volatility in the coming hours.
Two Scenarios Traders Are Watching
Upside Liquidity Grab Toward $95K
If bulls push into the $94.5K–$95K band, the thick liquidation cluster could get swept quickly. A clean break above $95K may open room toward $97K–$98K, where the next liquidity pocket sits. Failure to hold above $95K, however, would increase the odds of a reversal back into the range.
Downside Sweep Toward $90K
A move toward $90K–$91K would trigger heavy short liquidations. If the level fails to hold, BTC could briefly wick into $88K–$89K before finding buyers. The downside sweep is the higher-probability manipulation play when liquidity below spot is larger, as it appears currently.
The Bottom Line
Bitcoin’s price action may look calm, but the heatmap tells a different story. With liquidity stacking on both sides and volatility compressing, BTC is approaching an inflection point. Whichever side gets swept first may determine the next decisive leg—but traders should be prepared for a fast, possibly deceptive first move.
The post Bitcoin Price Is Trapped in a Liquidity Sandwich—Here’s What Happens Next appeared first on Coinpedia.org.


Read More