Key takeaways:
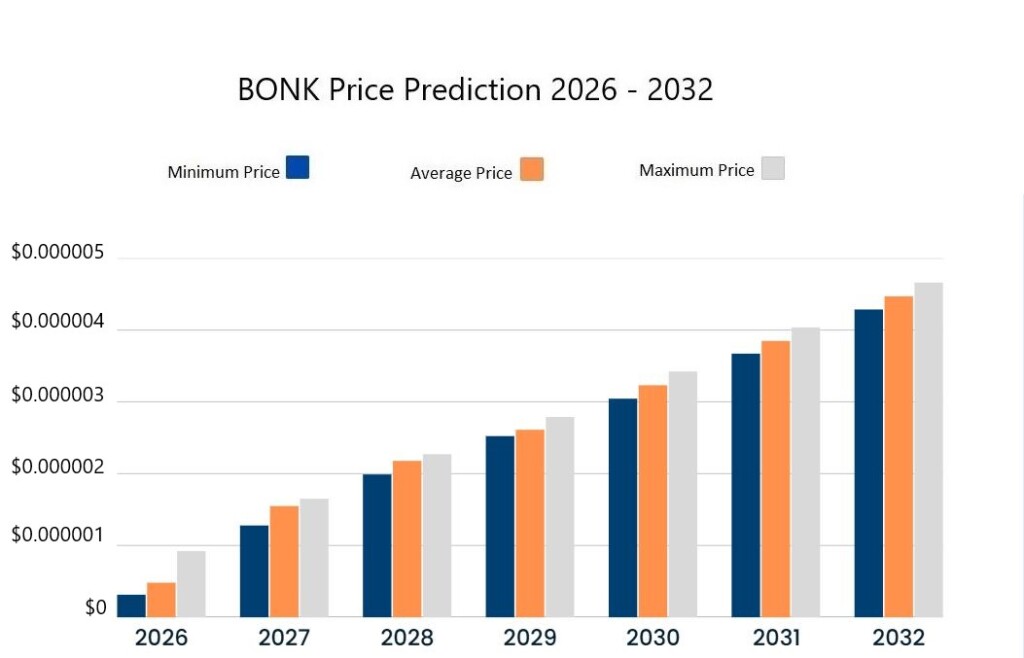
- Bonk price prediction for 2026 anticipates a maximum price of $0.00000921.
- Our Bonk price prediction for 2028 anticipates a price range of $0.00001989 to $0.00002271.
- In 2032, we expect the Bonk price to reach a maximum of $0.00004660 with an average of $0.00004469.
Bonk (BONK) is a crypto token built on the Solana blockchain, much like DOGE, WIF, or SHIB. Bonk is a digital asset that can be traded on a number of online platforms, such as Binance, KuCoin, Kraken, MEXC, CoinEx, OKX, gate.io, and Bybit.
Bonk has a maximum supply of 88.87 trillion. It is important to note that 87.99 trillion BONK are already in circulation. Interestingly, despite being a meme coin, Bonk’s supply is tied to its burning process to appreciate its value.
The token became popular in 2022 after an airdrop to the Solana community. Despite its popularity and appeal, Bonk is highly volatile, and wild swings in its price action are routine.
Along with being a meme coin, the Bonk ecosystem is far more diverse. Several projects built around Bonk also increase its utility prospects, which makes it a popular choice among traders and is also considered the primary trigger behind its 2024 bull run. Bonk Swap, Bonk Rewards, and Bonk BOT are the main features of the Bonk network that also drive Bonk’s price.
How will the utility of the Bonk ecosystem influence the value of the coin? Will BONK scale new heights? How high will BONK go in 2026?
Let’s get into the BONK price prediction for 2026 and beyond.
Overview
| Cryptocurrency | Bonk |
| Token | BONK |
| Price | $0.00000295 (-4.51%) |
| Market Cap | $260.09M |
| Trading Volume (24-hour) | $37.46M |
| Circulating Supply | 87.99T BONK |
| All-time High | $0.00005916 Nov 20, 2024 |
| All-time Low | $0.00000008614 Dec 29, 2022 |
| 24-h High | $0.000003113 |
| 24-h Low | $0.000002891 |
Bonk price prediction: Technical analysis
| Metric | Value |
| Price Volatility | 16.69% |
| 50-Day SMA | $0.000004014 |
| 14-Day RSI | 35.56 |
| Market Sentiment | Bearish |
| Fear & Greed Index | 29 (Fear) |
| Green Days | 12/30 (40%) |
| 200-Day SMA | $0.000005961 |
Bonk price analysis
TL;DR Breakdown:
- BONK price analysis confirms a downward trend toward $0.00000295.
- The coin price is retracing, as it is down by 4.51% over the last 24 hours.
- BONK’s key support sits at $0.00000275.
On July 28, 2026, Bonk’s price analysis indicates that the overall trend remains negative. The memecoin is trading around $0.00000295 following a partial recovery but remains down 4.51% over the past 24 hours. This retracement in price is mainly due to the formation of selling pressure near the expected resistance levels. Overall, the meme coin signals a trend continuation and diminishes hope for bullish traders as the downtrend seems to be continuing for now.
Bonk 1-day price chart analysis
The 1-day BONK price analysis indicates a broader downtrend despite a brief recovery attempt, as heavy overhead selling pressure persists. A full reversal seems unlikely given the larger bearish trajectory, with today’s minor bounce doing little to undo yesterday’s sharp correction.
The area between the upper and lower bands of the Bollinger Bands indicator shows the intensity of volatility. As the bands are covering comparatively more area, this signals high volatility. The upper limit of the Bollinger Bands indicator, indicating a resistance level, is at $0.00000422. Its lower limit, indicating support, is around $0.00000241.
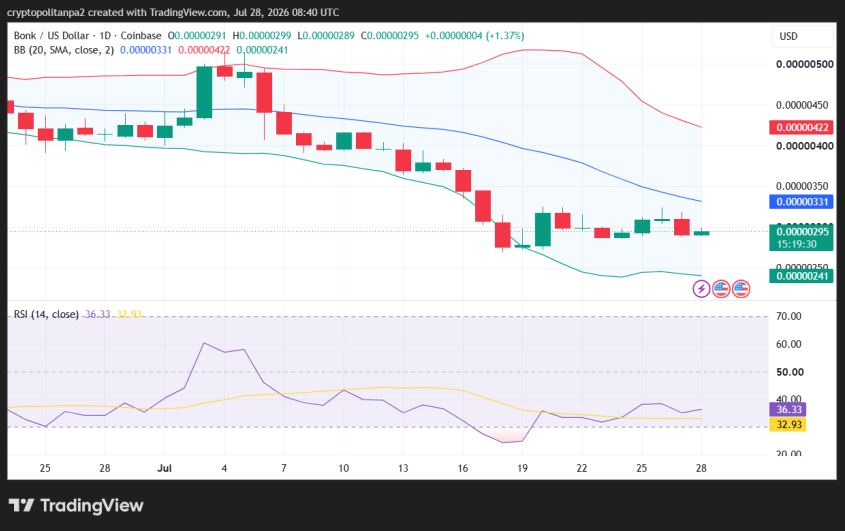
The Relative Strength Index (RSI) indicator is in the neutral region. The indicator’s value is 36, and its curve is slowly increasing as it moves upwards. The upward movement of the RSI confirms a bullish market sentiment at the moment. Moreover, considering the larger downtrend, this marks some degree of stability in the trading atmosphere as the market recovers following significant losses.
BONK/USD 4-hour price chart analysis
The 4-hour chart for BONK shows that bears return to take control as selling pressure continues. The BONK/USD pair value again decreased to $0.00000295. The selling activities remained high compared to the buying activities during the last four hours, as the sellers are trying to maintain their lead. This suggests a discouraging signal for investors waiting for price improvement. It is evident that the token is trending in its lowest price envelope, as the support present at $0.00000296 has been breached.
Volatility is on the higher end, which confirms higher market unpredictability. Moving ahead, the upper boundary of the Bollinger Bands indicator is at $0.00000320, confirming a resistance threshold. Conversely, the lower boundary of the Bollinger Bands indicator is at $0.00000288, indicating support.
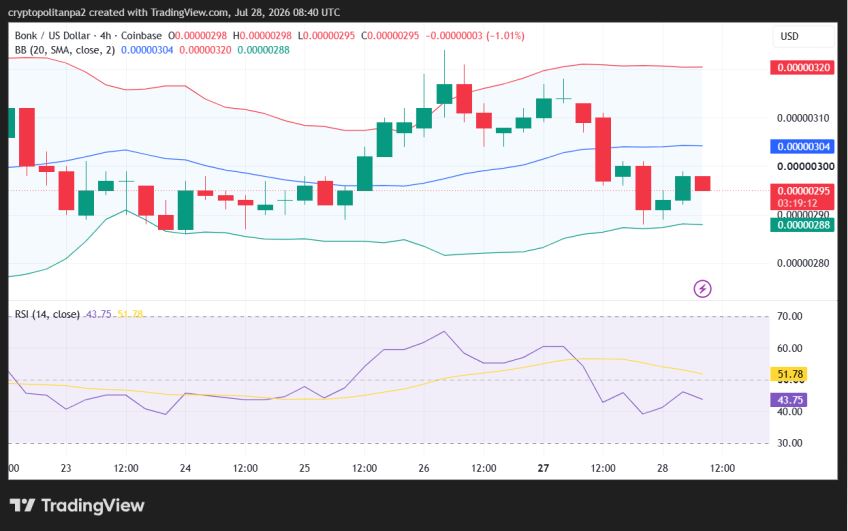
The RSI is trending downwards, hinting at the presence of bearish elements. In the past four hours, its value has further decreased to 43, as it moves down into the neutral region. This signals that selling pressure is present in the market, and sellers have gained full control. The RSI value can move further down if the bears keep trending for the next few hours.
Bonk technical indicators: Levels and action
Daily simple moving average (SMA)
| Period | Value ($) | Action |
|---|---|---|
| SMA 3 | 0.000003053 | SELL |
| SMA 5 | 0.000002997 | SELL |
| SMA 10 | 0.000002972 | BUY |
| SMA 21 | 0.000003412 | SELL |
| SMA 50 | 0.000004014 | SELL |
| SMA 100 | 0.000005046 | SELL |
| SMA 200 | 0.000005961 | SELL |
Daily exponential moving average (EMA)
| Period | Value ($) | Action |
|---|---|---|
| EMA 3 | 0.000003004 | SELL |
| EMA 5 | 0.000003014 | SELL |
| EMA 10 | 0.000003095 | SELL |
| EMA 21 | 0.000003379 | SELL |
| EMA 50 | 0.000003990 | SELL |
| EMA 100 | 0.000004780 | SELL |
| EMA 200 | 0.000006754 | SELL |
What to expect from Bonk price analysis?
Bonk price analysis predicts a bearish outcome regarding the ongoing market events. The coin’s value has partially recovered to $0.00000295, but the coin is at a loss over the 24-hour time period. Moreover, the overall market sentiment remained negative. Technical indicators give bearish signals, and the price charts also favor the sellers.
Is Bonk a good investment?
After its launch in December 2022, Bonk quickly gained traction. Being on the Solana blockchain triggered a surge in SOL’s price due to Bonk’s unique distribution strategy. Bonk is a meme coin, but it has numerous side projects that enhance its usability and make it more valuable than a mere dog meme coin. It is expected that by 2032, Bonk will approach $0.00004660, making it a worthwhile investment tool.
However, it is advised to do your own research and consult expert opinion before investing in the highly volatile meme coin market and lay out a proper investment strategy according to your risk appetite.
Why is Bonk down?
BONK is experiencing negative sentiment as the token maintains its lower price envelopes. Support still exists at $0.00000275 and is expected to be tested over the next few trading sessions.
Will Bonk reach $0.000044?
Bonk’s strongest current resistance level is $0.00000553. Over the last few weeks, BONK saw a downtrend below this level. Bonk may not break above this level in the short term, but according to market speculation, it will reach $0.00004660 by 2032. Considering several key factors and market dynamics, the BONK predictions are quite higher than its current price.
Will Bonk reach $1?
According to the Bonk price prediction, Bonk may not achieve the $1 level in the coming future. Considering future BONK price movements, it will take considerable time and significant growth in the coin’s market cap to reach $1, which seems impossible as of now, considering BONK’s current value.
Does Bonk have a good long-term Future?
Bonk has garnered much attention from investors with its community-driven value. However, analysts do not share the same sentiment and are divided in their views on the crypto pair. This is true to an extent, as after its initial surge, sustaining the momentum has proved a challenge for Bonk. However, analysts are optimistic about BONK, and some suggest long-term targets of $0.00004859, which makes it a viable option to buy Bonk tokens.
Recent news/opinions on Bonk
- the official Discord community server for BONKuji is now open and accessible to the public. BONKuji is a product platform built by the BONK ecosystem that focuses on bringing Japanese-style “Oripa” (mystery pack openings) on-chain for Real World Assets (RWAs).
Bonk price prediction July 2026
The current Bonk price prediction for July 2026 is a minimum value of $0.00000344 and an average price of $0.00000445. The price could reach a maximum of $0.00000660 during the month.
| Month | Potential Low | Potential Average | Potential High |
| July 2026 | $0.00000344 | $0.00000445 | $0.00000660 |
Bonk price prediction 2026
The Bonk price prediction for 2026 is a minimum value of $0.00000314 and an average price of $0.00000482. The price could reach a maximum of $0.00000921 during the year.
| Year | Potential Low | Potential Average | Potential High |
| 2026 | $0.00000314 | $0.00000482 | $0.00000921 |
Bonk price predictions 2027-2032
| Year | Minimum Price | Average Price | Maximum Price |
| 2027 | $0.00001278 | $0.00001549 | $0.00001651 |
| 2028 | $0.00001989 | $0.00002178 | $0.00002271 |
| 2029 | $0.00002523 | $0.00002611 | $0.00002789 |
| 2030 | $0.00003044 | $0.00003231 | $0.00003423 |
| 2031 | $0.00003671 | $0.00003848 | $0.00004037 |
| 2032 | $0.00004286 | $0.00004469 | $0.00004660 |
Bonk price prediction 2027
The Bonk price forecast for 2027 suggests BONK cryptocurrency could reach a minimum price of $0.00001278 and an average price of $0.00001549. BONK coin is estimated to reach a maximum price of $0.00001651.
Bonk price prediction 2028
Bonk coin price forecast for 2028 estimates a minimum value of $0.00001989 and an average trading price of $0.00002178. The maximum price forecast for 2028 is $0.00002271.
Bonk price prediction 2029
The Bonk forecast for 2029 predicts that the price of 1 BONK will reach a minimum of $0.00002523. The BONK price can reach a maximum level of $0.00002789, with an average price of $0.00002611 throughout 2029.
Bonk price prediction 2030
The Bonk price prediction for 2030 estimates that BONK will attain a minimum value of $0.00003044, an average price of $0.00003231, and a maximum price of $0.00003423.
Bonk price prediction 2031
According to the Bonk price forecast for 2031, BONK is predicted to reach a minimum price of $0.00003671 and an average price of $0.00003848 throughout 2031. The maximum forecasted BONK price for 2031 is $0.00004037.
Bonk price prediction 2032
The Bonk price forecast for 2032 is for BONK to trade at a minimum price of $0.00004286 and an average price of $0.00004469. The maximum forecast price for 2032 is $0.00004660.
Bonk market price prediction: Analysts’ BONK price forecast
| Firm Name | 2026 | 2027 |
| Coincodex | $0.000003994 | $0.00008668 |
| Digitalcoinprice | $0.00000543 | $0.00000996 |
Cryptopolitan’s Bonk (BONK) price prediction
Our forecast indicates that Bonk will reach a high price of $0.00000921 by the end of 2026. In 2027, the Bonk price is expected to range between $0.00001278 and $0.00001651. In 2032, the cryptocurrency is expected to range between $0.00004286 and $0.00004660, with an average price of $0.00004469.
It is essential to note that the predictions do not constitute investment advice. Professional consultation is suggested, or one should do their own research.
Bonk historic price sentiment
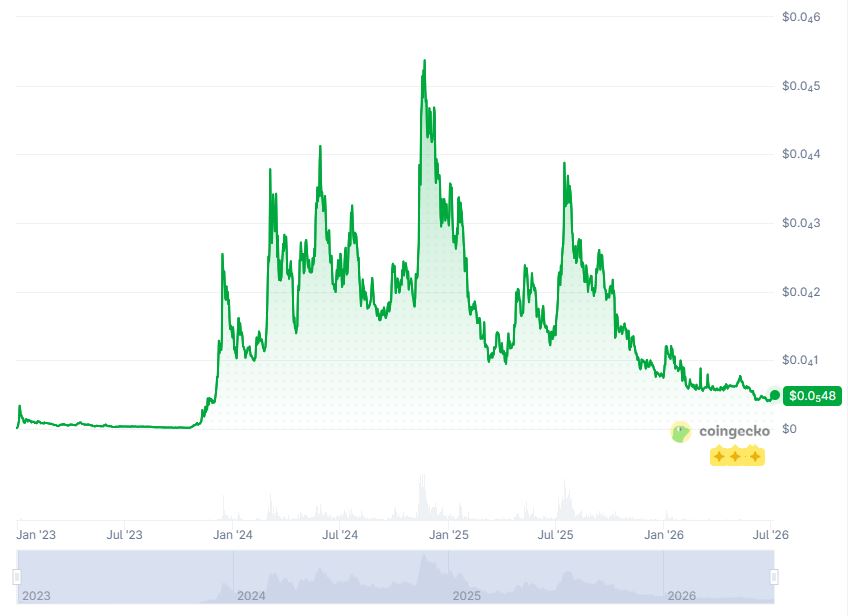
- In December 2022, Bonk was launched with an opening price of $0.0000001487 and made history by making a surge of more than 30% in SOL tokens.
- Bonk cryptocurrency quickly climbed into the top 100 by market cap, reaching $0.0000034 per coin on January 5, 2023, giving a bullish outlook according to crypto market records.
- However, by March 2023, the price of the Bonk token had fallen from $0.0000004134, losing substantial value.
- In June 2023, Bonk’s price did not experience much action, and it gradually decreased to $0.0000001927 in September 2023.
- In October 2023, Bonk started to see bullish sentiment, with the price reaching $0.0000005518, which eventually reached $0.00002445 on December 15, 2023, as the market trends were on the positive side.
- Bonk closed 2023 with a price tag of $0.00001407, significantly higher than the price at the start of the year but almost 50% down from the highest price point of 2023.
- Bonk hit key highs in 2024, when the price of BONK rose to $0.00003771 in March and an all-time high of $0.00004115 in May, before dipping to $0.0000223 in August. A late-year rally peaked at $0.00005825 in November, with the token closing 2024 at $0.00003043.
- At the start of January 2025, Bonk was trading at $0.00002976, and after further depreciation, it plunged to $0.000018 by February, as the market sentiment turned negative.
- In March, the token dipped to $0.00000959, but it recovered to $0.0000122 in April and $0.000021 in May as Bonk demand increased.
- In June, Bonk corrected down to $0.00001201, but in July 2025, it became bullish again and reached $0.00004072.
- In the middle of August, BONK was trending near $0.00002374, and at the start of October, Bonk was trading near $0.00002056.
- In November, Bonk traded between $0.00000847 – $0.00001379, and at the start of December, the coin was trading between $0.000009769 – $0.00001015.
- As 2026 started, BONK was trending near the $0.00000910 range, but in March, it decreased to the $0.0000059 level, below the key price levels of $0.0000060.
- BONK stepped further down in April, trading near $0.0000057. While in May, it slightly recovered to $0.0000062.
- At the start of June, BONK was trending near $0.0000049. It has maintained a similar range into July, hovering around $0.0000048 in line with the current market sentiment, which remains bearish.

Read More