


Key takeaways:
- Bittensor price predictions anticipate a high of $368.91 by the end of 2026.
- In 2028, TAO will range between $501.56 and $589.68, with an average price of $542.55.
- In 2032, TAO will range between $1,145.75 and $1,241, with an average price of $1,192.74.
Bittensor is one of the most renowned AI-facilitated decentralized networks that promotes blockchain and artificial intelligence infusion. By leveraging Proof of Learning (POL) technology, Bittensor supports user privacy while minimizing errors. The AI models within the network are reliable, flexible, and up-to-date with modern technological advancements. The AI-based Bittensor network prioritizes cross-chain integration and native token expansions to promote collaboration among various decentralized AI networks.
TAO uses reliable authentication methods to ensure a successful transfer of nodes through its AI knowledge to correct models. The process is made possible through the PoL consensus method, which secures this process. Moreover, this technology helps to develop different stages of more advanced AI technology within the blockchain. Bittensor also uses its TAO token to incentivize node operators and AI developers.
What’s next for Bittensor and TAO in 2026 and beyond? Let’s get into the TAO price prediction and technical analysis.
Overview
| Cryptocurrency | Bittensor |
| Ticker | TAO |
| Current price | $190.13 (-0.49) |
| Market cap | $2.12B |
| Trading volume (24-hour) | $83.53M |
| Circulating supply | 11.16M TAO |
| All-time low | $30.40 on May 14, 2023 |
| All-time high | $767.68 on Apr 11, 2024 |
| 24-hour low | $192.26 |
| 24-hour high | $187.41 |
TAO price prediction: Technical analysis
| Metric | Value |
| Price Volatility (30-day variation) | 3.70% |
| 14-day RSI | 37.46 |
| 50-day SMA | $213.63 |
| 200-day SMA | $239.37 |
| Market Sentiment | Bearish |
| Fear and greed index | 27 (Fear) |
| Green days | 13/30 (43%) |
Bittensor price analysis
TL;DR Breakdown:
- TAO price analysis shows a bearish trend at $190.13.
- The altcoin has lost 0.49% over the day.
- TAO token faces resistance at $197.
On July 25, 2026, TAO price analysis indicates a bearish daily trend, with Bittensor currently trading at $190.13. The altcoin has shown a 0.49% decrease in value over the last 24 hours, primarily due to continuous selling pressure observed in the market for a fourth consecutive day. TAO is facing overhead resistance at the $197 level, while it has support around the $185 level.
TAO/USD 1-day chart analysis
The one-day price chart of Bittensor confirmed a bearish trend for the altcoin. The TAO/USD pair shows a further intraday correction to $190.13 following a bearish dip. The comparatively low volatility suggests a lower chance of a reversal in the trend or further price depreciation.
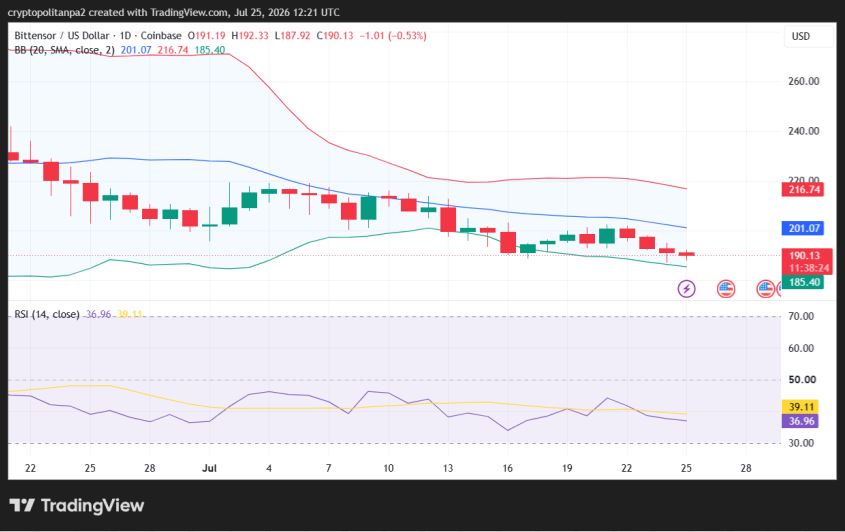
The distance between the Bollinger Bands determines the market volatility. Currently, this distance is narrow, leading to low volatility levels. Moreover, the upper limit of the Bollinger Bands indicator, indicating resistance, has shifted to $216. Whereby its lower limit, indicating a broken support, has moved to a low of $185.
The Relative Strength Index (RSI) indicator is in the neutral region, in contrast to the other technical factors, which seem to be bearish. Its curve also decreased to 36 during the day. This decreasing price movement today reflects a relatively imbalanced trading setup in the market, and if the bearish momentum accelerates, the RSI value will move further down into the neutral region.
TAO/USD 4-hour chart analysis
The four-hour price chart for the Bittensor coin shows an hourly bullish trend, as the token’s price movements are now in an upward direction, with buyers attempting to control the market. In the past few hours, the cryptocurrency’s value has again recovered to $190.13 after finding support. Green candlesticks on the price chart signal a returning buying interest.
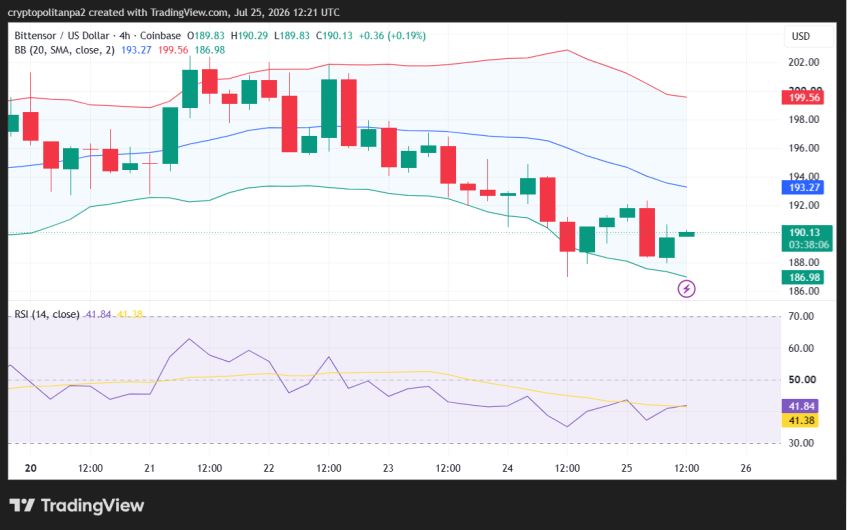
The Bollinger Bands are expanded, as the volatility level is high on the 4-hour chart. The high volatility suggests higher market unpredictability. The upper Bollinger Band has shifted to a $199 high, indicating the resistance level. Conversely, the lower Bollinger Band is at $186, indicating the support level.
Multiple technical quantitative indicators are bearish, but the RSI indicator is also moving upwards into the neutral region. The current score of 41 and increasing numbers confirm buying interest. The inclining curve on the indicator’s graph shows rising buying activity and bullish progress as the market conditions turn favorable on an hourly basis.
Bittensor technical indicators: Levels and actions
Daily simple moving average (SMA)
| Period | Value ($) | Action |
|---|---|---|
| SMA 3 | 193.68 | SELL |
| SMA 5 | 195.35 | SELL |
| SMA 10 | 195.68 | SELL |
| SMA 21 | 203.02 | SELL |
| SMA 50 | 213.63 | SELL |
| SMA 100 | 240.95 | SELL |
| SMA 200 | 239.37 | SELL |
Daily exponential moving average (EMA)
| Period | Value ($) | Action |
|---|---|---|
| EMA 3 | 193.14 | SELL |
| EMA 5 | 194.41 | SELL |
| EMA 10 | 196.75 | SELL |
| EMA 21 | 201.90 | SELL |
| EMA 50 | 215.49 | SELL |
| EMA 100 | 230.33 | SELL |
| EMA 200 | 249.09 | SELL |
What can we expect from Bittensor price analysis next?
Bittensor (TAO) fundamental analysis indicates a bearish outlook for current market trends. The TAO/USD price has further decreased to $190.13, as the bearish momentum has overtaken the market. Most of the technical indicators signal bearishness, and the price charts also favor sellers, suggesting a potential move toward the $175 level.
Is Bittensor TAO a good investment?
TAO coin continues to trade higher, indicating growing adoption among crypto investors as AI development and machine learning progress. Despite this, the coin faces uncertainties and volatility like all other cryptocurrencies. Our Cryptopolitan price prediction explores its potential profit and expected movements from 2026 to 2032 while considering the past performance. However, this is not investment advice, and one must conduct their own research before taking any investment decision according to their risk tolerance.
Why is TAO down?
TAO is down primarily due to selling pressure from traders after some degree of bullish price action, which was mainly due to strong market sentiment surrounding speculative AI tokens and the AI industry at large. However, recent instability near key expected support levels also played a role in the resurrection of the bearish trend as traders started selling. The token’s price has further decreased after going through a correction during the past 24 hours.
How much is the Bittensor stock worth?
Bittensor (TAO) powers the Bittensor Network and is not a stock. Stocks are usually traded on stock exchanges, and stock ownership represents a stake in a company. Buying TAO tokens gives the buyer certain rights within the Bittensor Network, for example, governance participation but not ownership in a company. However, Bittensor (TAO) tokens can be purchased and traded on different exchanges, including Binance, Bitget, Coinbase, KuCoin, and Kraken. See our price analysis part for day-to-day price changes of the TAO token.
What is the price prediction for TAO 2026?
The highest Bittensor (TAO) price prediction for 2026 is around $368.91, but it is not easy to predict Bittensor price movements due to its volatile nature. TAO’s performance is tied directly to global retail and institutional interest in AI and machine learning developments.
Will Bittensor reach $1000?
Yes, the price of Bittensor should surpass $1000 by 2031. Its price will range between $987.45 and $1,076 during that period, which makes it a viable option to buy Bittensor tokens, considering the future performance and long-term trends, as decentralized AI development is expected to scale exponentially.
What are the specific support levels and the maximum resistance targets for TAO?
Bittensor’s price is influenced by key support levels at $201, $195, and $185, while resistance levels are identified at $228, $247, and $265.
How do large holders affect TAO’s price given the asset’s relatively small market size?
The activity of ‘whales’, or entities that control large amounts of Bittensor, can have a substantial impact on the price movements of TAO due to the relatively small size of the market compared to traditional assets.
What is the total supply of Bittensor?
Bittensor has a fixed maximum supply of 21 million tokens, leading to potential supply shock due to algorithmic emission halvings. Current factors influencing Bittensor price predictions also include token supply dynamics, along with institutional exposure, network revenue, and the AI-crypto market narrative.
What caused high staking illiquidity for TAO, and how did Bittensor expand to Solana?
Over 70% of the circulating supply of TAO is locked in network staking and subnet validation, creating high staking illiquidity. Bittensor generated $43 million in real AI usage revenue in Q1 2026. As of May 2026, Bittensor’s ecosystem has expanded its reach by bridging the TAO token to the Solana network, enhancing DeFi liquidity.
Does Bittensor have a good long-term future?
According to most market observers, Bittensor TAO will trade higher in the coming years. Based on the latest data, machine learning models project an estimated upward trend for the network. This growth underscores the long-term potential of the underlying blockchain technology and its value as a digital asset. However, factors like market crashes or difficult regulations could invalidate this bullish theory.
Bittensor (TAO) is positioned as a key asset that could benefit from upcoming legislative clarity in the U.S., including momentum surrounding the CLARITY Act. However, the price action of Bittensor is primarily driven by supply and demand dynamics, which can be influenced by fundamental events such as hacks and other real-world occurrences.
Recent news/ opinions on Bittensor
- The subtensor repository has been officially moved to the Rao Foundation account. It’s the next step in Opentensor’s decentralization plan.
- The OKX exchange launched OKX AI, with the support of the OpenStensor Foundation. The new AI is capable of turning agent capabilities into onchain services, tasks, and reputation.
Bittensor price prediction July 2026
A break of resistance will result in a mini bull run, with the next target at $290 during the month. The average price is expected to be $225, according to the current forecast. In a bearish scenario, TAO could drop to $175 at its lowest.
| Month | Potential low | Potential average | Potential high |
| July 2026 | $175 | $225 | $290 |
Bittensor price prediction 2026
The technical indicators are bullish on TAO for the end of 2026. It is anticipated to trade between $134 and $368.91, with an average price of $257.98, according to the Bittensor price prediction.
| Year | Potential low | Potential average | Potential high |
| 2026 | $134 | $257.98 | $368.91 |
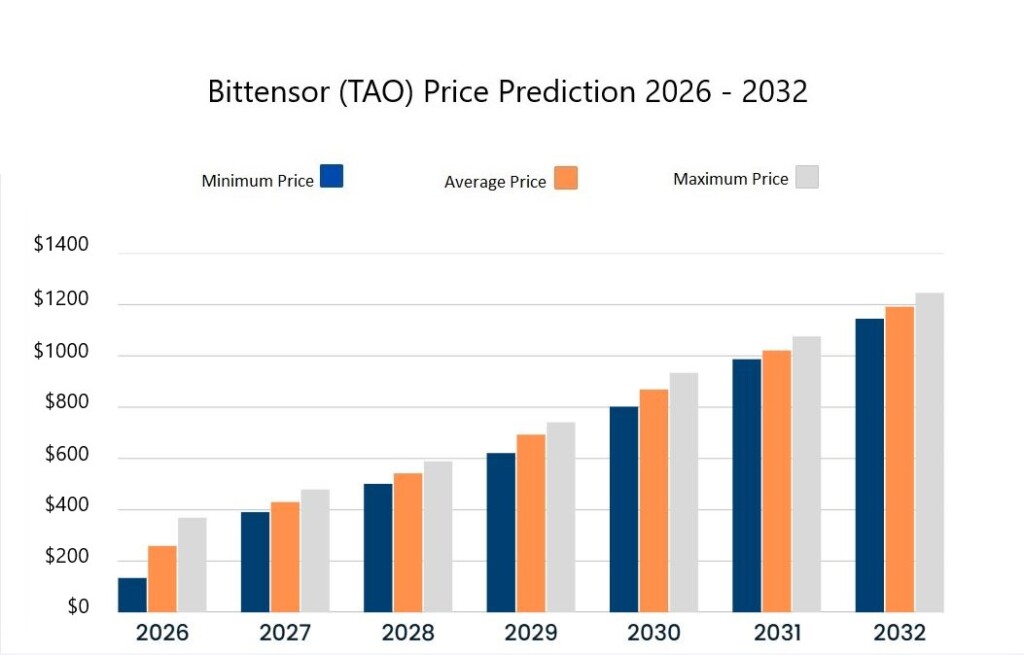
Bittensor price predictions 2027-2032
| Year | Minimum Price | Average Price | Maximum Price |
| 2027 | $391.26 | $430.25 | $479.63 |
| 2028 | $501.56 | $542.55 | $589.68 |
| 2029 | $621.86 | $693.84 | $741.25 |
| 2030 | $802.15 | $869.14 | $934.35 |
| 2031 | $987.45 | $1,021.44 | $1,076 |
| 2032 | $1,145.75 | $1,192.74 | $1,241 |
Bittensor’s price forecast 2027
TAO is expected to gain bullish momentum in 2027. According to the updated Bittensor forecast, the token will range between $391.26 and $479.63, with an average price of $430.25.
Bittensor price prediction 2028
The Bittensor outlook strengthens further in 2028. Analysts expect TAO to trade between $501.56 and $589.68, with an average yearly price of $542.55.
Bittensor TAO price prediction 2029
The 2029 Bittensor price prediction suggests TAO will move between a minimum of $621.86 and a maximum of $741.25, settling at an average price of $693.84 for the year.
Bittensor price prediction 2030
For 2030, Bittensor price predictions indicate a trading range from $802.15 to $934.35, with an average expected price of $869.14.
Bittensor crypto price prediction 2031
In 2031, Bittensor price prediction, TAO is projected to range between $987.45 and $1,076, with an average price of $1,021.44, which is quite higher than its current value.
Bittensor price prediction 2032
The Bittensor price prediction for 2032 places TAO between $1,145.75 and $1,241, with an average price of $1,192.74.
TAO market price prediction: Analysts’ TAO price forecast
| Platform | 2026 | 2027 |
| Digitalcoinprice | $179.09 | $249.67 |
| Coincodex | $249.67 | $503.70 |
Cryptopolitan’s Bittensor (TAO) price prediction
According to our predictions, TAO could recover to $368.91 by the end of December 2026. We expect TAO to maintain a trading range of $391.26-$479.63, with an average of $430.25 in 2027. Note that the predictions are not investment advice. Seek independent professional consultation or do your research.
Bittensor (TAO) historic price sentiment
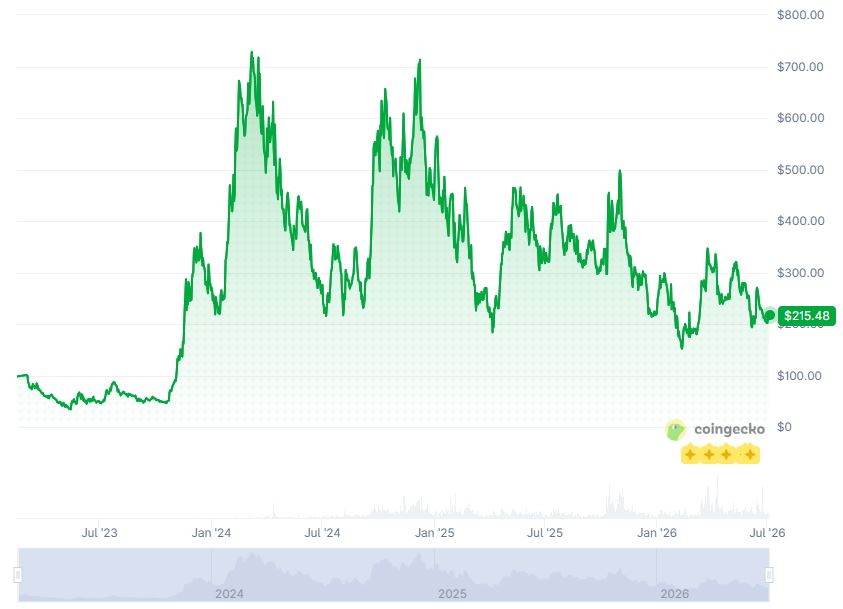
- TAO launched on March 6, 2023, at $93.4, but fell below its opening price within a week, sliding into the $76 range.
- By early April, it had lost half its value, dropping to $47, and continued downward to its $30.83 low in May before slowly recovering to $63 by the end of the month.
- The token climbed to $86.18 in July, just under its launch price, then pulled back again and traded near $54 through October.
- Momentum returned in November, pushing TAO into the $95 range, showing continuous improvement, and then sharply to a peak of $379 on December 15, 2023.
- TAO trended downward into early 2024 but surged to its all-time high of $757.60 in March. It quickly corrected to $522 in April and continued weakening through mid-year, reaching $216 in July.
- A brief rebound to $357 faded again as the token slipped back toward the mid-$200s by late summer, as per the crypto market price history records.
- Momentum returned in October, pushing TAO into the $660 range before cooling to $468, according to the historical price data. It climbed once more to $679 in November but ultimately closed 2024 at $440.69, as the broader crypto market turned bearish again.
- TAO opened in 2025 at $439.73, peaked at $565 in January, and its price decreased to the $324 level in February, taking down the token’s market capitalization as the technical indicators turned bearish due to some fundamental factors.
- In March, TAO dipped to the $259 mark and descended further to $228 in April; however, in May, it recovered to $467 as the Bittensor market revived.
- In October, TAO observed its year’s lowest prices extending toward $200.44.
- TAO opened trading in November at $506, lost 46% of its value, and closed the month at $269.11, while at the start of December, the coin was trading between $256.29 and $298.90.
- At the start of January 2026, TAO was trading near the $223 range, as the market shifted towards the bearish side.
- In March, TAO traded below the psychological level of $200, but it surged past $300 in the month of April. At the start of May, TAO decreased to the $260 range once again.
- As July began, TAO kept trading in the middle price envelope of the year, above $200, as current market sentiment turned decidedly bearish.


Read More


