The post Quant Price Prediction 2026, 2027 – 2030: How High Can QNT Go in the Next Decade? appeared first on Coinpedia Fintech News
Story Highlights
- The price of the Quant token is $ 75.41236518.
- Price predictions for 2026 range from $150 to $280.
- QNT could extend toward $1000 by 2030, if the recovery structure holds.
Quant (QNT) enters 2026 in a position that few infrastructure-focused crypto assets currently share, technically compressed, fundamentally stable, and largely absent from short-term speculation. While much of the market continues to rotate between momentum-driven narratives, Quant’s price action has quietly tightened into a multi-year range, reflecting restraint rather than weakness. Quant’s positioning has remained consistent. Built around its Overledger technology, the project continues to focus on enterprise-grade blockchain interoperability rather than retail experimentation.
This long-term orientation has allowed Quant to develop outside the spotlight, even as speculative capital flowed elsewhere. Technically, this divergence is beginning to show. Volatility has contracted, downside reactions have become more controlled, and long-term support zones are holding with increasing reliability. As the market looks ahead to 2026, the key question is whether this prolonged compression marks exhaustion, or the early stages of a broader repricing cycle.
Table of contents
Quant Price Today
| Cryptocurrency | Quant |
| Token | QNT |
| Price | $75.4124 |
| Market Cap | $ 910,433,726.84 |
| 24h Volume | $ 10,662,805.7573 |
| Circulating Supply | 12,072,738.00 |
| Total Supply | 14,881,364.00 |
| All-Time High | $ 428.3847 on 11 September 2021 |
| All-Time Low | $ 0.1636 on 23 August 2018 |
Quant (QNT) Price Prediction for April 2026
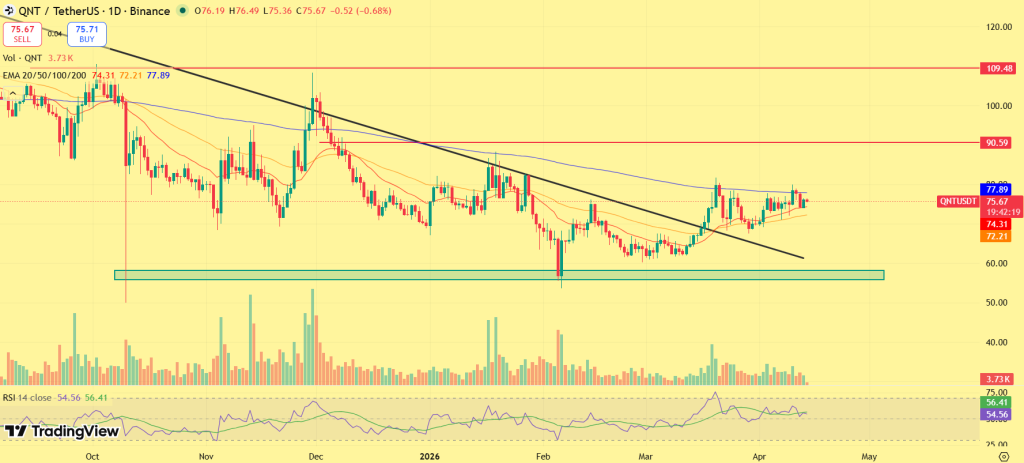
QNT’s current structure reflects a market attempting to transition from a downtrend into a potential breakout phase. The descending trendline, which has capped price since late 2025, is now being tested repeatedly. Each retest shows diminishing rejection strength, indicating that sellers are gradually losing control. At the same time, price is holding above its short- to mid-term moving averages, suggesting improving momentum.
The immediate resistance lies in the $90–$100 range, which aligns with previous rejection zones and horizontal supply. A breakout above this region would confirm a structural shift, effectively invalidating the prior downtrend. Once this level is cleared, the path toward higher liquidity zones opens rapidly. Under a confirmed breakout scenario, QNT in April could extend toward the $110–$120 range, reflecting a move from compression into expansion.
However, failure to reclaim the $90 level may result in continued consolidation, with price likely rotating between $65 and $85 before the next attempt.
CoinPedia’s Quant (QNT) Price Prediction 2026
Looking at the broader structure, QNT appears to be moving through the final stages of a corrective phase and into early recovery positioning. The prolonged downtrend has allowed the market to establish a strong accumulation base, particularly around the $55–$60 demand zone, which has consistently absorbed selling pressure. This area now acts as a structural foundation for any sustained upside move. The recovery path is clearly defined through key resistance levels.
A confirmed breakout above $100 would mark the first major shift in market structure, followed by expansion toward the $140–$160 range, where prior consolidation occurred. These levels act as checkpoints where momentum is expected to build progressively. Beyond this, the structure opens toward higher liquidity zones. If QNT successfully transitions into a sustained recovery cycle, the price could advance toward the $180–$280 range in 2026, reflecting a full structural reversal from the previous downtrend.
However, this trajectory depends on maintaining higher lows and consistently reclaiming resistance levels. A failure to hold above the $60 region would weaken the bullish outlook and extend the consolidation phase.
Recent Catalysts for Quant (QNT)
Growing focus on cross-chain interoperability, strengthening Quant’s long-term positioning.
Increasing institutional interest in blockchain infrastructure, supporting protocols with enterprise use cases.
Ongoing development around Overledger and ecosystem integrations, reinforcing network relevance.
Quant Crypto Price Prediction 2026 – 2030
| Year | Potential Low ($) | Potential Average ($ | Potential High ($) |
| 2026 | 120 | 180 | 280 |
| 2027 | 180 | 260 | 380 |
| 2028 | 270 | 390 | 560 |
| 2029 | 420 | 620 | 820 |
| 2030 | 700 | 850 | 1000 |
Quant (QNT) Price Prediction 2026
In 2026, the Quant price could project a low price of $120, an average price of $180, and a high of $280.
Quant (QNT) Price Forecast 2027
As per the Quant Price Prediction 2027, QNT may see a potential low price of $180. Meanwhile, the average price is predicted to be around $260. The potential high for QNT price in 2027 is estimated to reach $380.
QNT Price Prediction 2028
In 2028, the Quant price is forecasted to potentially reach a low price of $270 and a high price of $560.
Quant Price Prediction 2029
Thereafter, the Quant (QNT) price for the year 2029 could range between $420 and $820.
Quant (QNT) Price Prediction 2030
Finally, in 2030, the price of Quant is predicted to remain steadily positive. It may trade between $700 and $1000.
Quant Price Prediction 2031, 2032, 2033, 2040, 2050
The long-term projection assumes Quant sustains relevance in enterprise blockchain use cases, with growth moderating over time as the asset matures.
| Year | Potential Low ($) | Potential Average ($) | Potential High ($) |
| 2031 | 720 | 900 | 1120 |
| 2032 | 780 | 1020 | 1280 |
| 2033 | 850 | 1150 | 1450 |
| 2040 | 1100 | 1500 | 2300 |
| 2050 | 1800 | 2500 | 3000 |
Quant (QNT) Price Prediction: Market Analysis?
| Year | 2026 | 2027 | 2030 |
| Changelly | $250 | $350 | $900 |
| CoinCodex | $220 | $310 | $780 |
| WalletInvestor | $245 | $340 | $820 |
Never Miss a Beat in the Crypto World!
Stay ahead with breaking news, expert analysis, and real-time updates on the latest trends in Bitcoin, altcoins, DeFi, NFTs, and more.
FAQs
Quant is used to power Overledger, a platform that connects different blockchains so enterprises and banks can build secure multi-chain applications.
Quant is expected to range between $120 and $280 in 2026, with price strength improving if it holds support and clears $200.
If adoption continues, 1 QNT could trade between $700 and $1,000 by 2030, reflecting steady enterprise growth rather than hype cycles.
By 2050, QNT could trade between $1,800 and $3,000 if it remains relevant in enterprise blockchain infrastructure long term.
Quant focuses on enterprise blockchain interoperability via Overledger, prioritizing real-world use cases over short-term hype.
Quant shows steady fundamentals and strong long-term support. If it holds key levels and breaks resistance, 2026 could favor gradual upside.
The post Quant Price Prediction 2026, 2027 – 2030: How High Can QNT Go in the Next Decade? appeared first on Coinpedia.org.


Read More