Key Takeaways:
- dYdX price faces volatility at $0.13.
- Our dYdX price prediction for 2026 expects a maximum price of $0.4.
- In 2032, we expect the dYdX price to touch $2.81.
The dYdX exchange captured significant attention last year. The platform aimed to migrate its existing dYdX tokens from Ethereum to this new mainnet. However, in the fall of 2024, the platform disclosed that it was reducing its workforce by 35%.
As dYdX’s on-chain activities surge, questions arise, such as: “Does dYdX have the potential to hit the $1 mark soon?” or “Will dYdX ever go up?” or “Where will dYdX be in 5 years?” Let’s answer them using our dYdX price prediction.
Overview
| Cryptocurrency | dYdX |
| Token | dYdX |
| Price | $0.13 (+0.3%) |
| Market Cap | $158.84 Million |
| Trading Volume | $7.07 Million |
| Circulating Supply | 819.71 Million dYdX |
| All-time High | $4.53 (Mar 08, 2024) |
| All-time Low | $0.0666 (Oct 11, 2025) |
| 24-hour high | $0.167 |
| 24-hour low | $0.15 |
dYdX price prediction: Technical analysis
| Metric | Value |
| Current Price | $ 0.1295 |
| Price Prediction | $ 0.09580 (-24.84%) |
| Fear & Greed Index | 27 (Fear) |
| Sentiment | Bearish |
| Volatility | 12.15% (Very High) |
| Green Days | 15/30 (50%) |
| 50-Day SMA | $ 0.1441 |
| 200-Day SMA | $ 0.1358 |
| 14-Day RSI | 44.56 (Neutral) |
dYdX price analysis: dYdX faced bearish pressure toward $0.13
TL;DR Breakdown:
- dYdX price analysis shows that dYdX faced bearish pressure toward $0.13
- Resistance for dYdX is at $0.14645
- Support for dYdX/USD is at $0.12402
The dYdX price analysis for 10 July confirms that dYdX faced a decline as sellers gained confidence. Currently, sellers are dominating, resulting in a push toward $0.13.
dYdX price analysis 1-day chart: dYdX price declines toward $0.13
An analysis of the daily dYdX price chart shows the token faced selling pressure after the price was pushed below immediate support channels. As a result, sellers are now aiming for a hold around $0.13. The 24-hour volume surged to $1.04 million, showing an increase in trading interest today. dYdX is trading at $0.133, decreasing by over 0.33% in the last 24 hours.
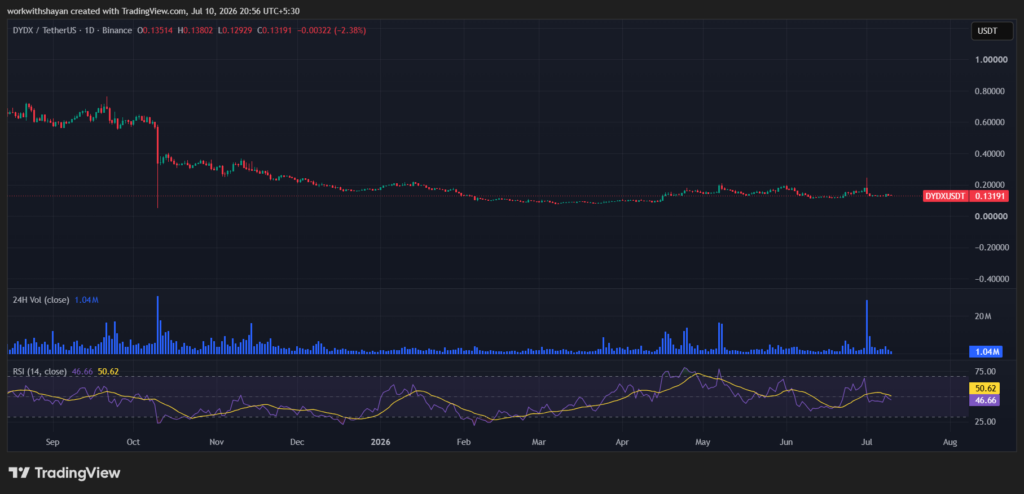
The RSI-14 trend line has surged from its previous level and trades around 46, hinting that buyers are aiming to control momentum. The SMA-14 level suggests volatility in the next few hours.
dYdX/USD 4-hour price chart: Bulls aim for an immediate correction
The 4-hour dYdX price chart suggests that sellers are strengthening their positions as they aim for a hold of the price below the EMA trend lines. However, buyers are aiming to push the price through each resistance level.
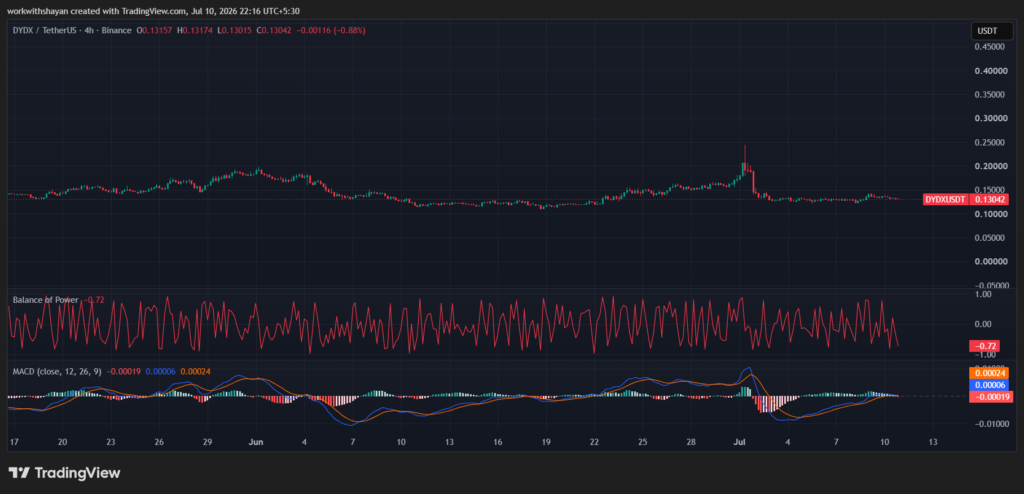
The BoP indicator trades in a bearish region at 0.72, showing that short-term sellers are taking a chance to accelerate an upward trend.
Additionally, the MACD trend line has formed green candles below the signal line, and the indicator aims for a positive momentum, strengthening long-position holders’ confidence.
dYdX technical indicators: Levels and action
Daily simple moving average (SMA)
| Period | Value | Action |
| SMA 3 | $ 0.1288 | SELL |
| SMA 5 | $ 0.1298 | SELL |
| SMA 10 | $ 0.1414 | SELL |
| SMA 21 | $ 0.1378 | SELL |
| SMA 50 | $ 0.1438 | SELL |
| SMA 100 | $ 0.1386 | SELL |
| SMA 200 | $ 0.1356 | SELL |
Daily Exponential Moving Average (EMA)
| Period | Value | Action |
| EMA 3 | $ 0.1290 | SELL |
| EMA 5 | $ 0.1313 | SELL |
| EMA 10 | $ 0.1358 | SELL |
| EMA 21 | $ 0.1382 | SELL |
| EMA 50 | $ 0.1400 | SELL |
| EMA 100 | $ 0.1414 | SELL |
| EMA 200 | $ 0.1801 | SELL |
What to expect from dYdX price analysis next?
The hourly price chart confirms that dYdX is attempting a dip below the immediate support line; however, bulls are eyeing an upside recovery rally in the coming hours. If dYdX’s price holds momentum above $0.14645, it will fuel a bullish rally to $0.16496.
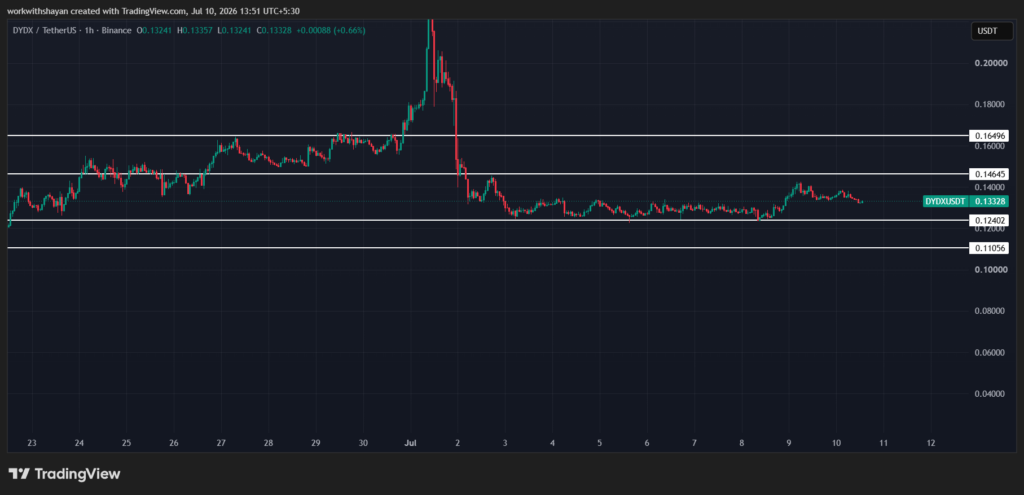
If bulls fail to initiate a surge, the dYdX price may drop below the immediate support line at $0.12402, beginning a bearish trend to $0.11056.
Is dYdX a good investment?
The rising institutional demand for dYdX makes it a good investment option. However, dYdX has a short investment history filled with very volatile phases. Whether it is a good investment depends on your financial profile, investment portfolio, risk tolerance, and investment goals.
Why is dYdX up today?
The overall dydx market sentiment is bullish as buyers pushed the price above resistance channels. This resulted in a push toward $0.16.
Will dYdX Recover?
If buyers hold above $0.2 level strongly, we might see a strong recovery in the coming hours.
What is the dYdX price prediction for 2026?
The price of 1 dYdX is expected to reach a minimum level of $0.1 by the end of 2026. Traders and investors can expect a maximum level of $0.4 and an average price of $0.3 if the bulls show up. Short-term models predict a slight downward correction for dYdX, potentially dipping to a minimum of $0.1155 by late June 2026.
Will dYdX reach $1?
Depending on market sentiment, dYdX might hit the $1 mark by the end of 2030. However, any bearish news might weaken this prediction.
Will the dYdX price reach $10?
$10 will be a significant milestone for dYdX. However, it is achievable if dYdX continues to attract institutional interest in the coming years.
Is dYdX a good long-term investment?
As several institutions continue to accumulate dYdX and it faces a rise in global recognition, dYdX has a solid long-term future. It is advised to seek independent professional consultation and investment advice from experts before investing in the crypto market, which has high price volatility.
Recent news/opinion on dYdX
Kevin Warsh was sworn in as Federal Reserve Chair on May 22, 2026. During his April confirmation hearings, he disclosed holdings in over 20 blockchain entities, including dYdX and Solana, and pledged to divest them
dYdX price prediction July 2026
dYdX’s price might attempt to hold around $0.15 from its recent low and be pushed further, at least $0.19, if strong downward pressures are not seen. However, we might see a rejection by the bearish side, leading to a consolidation around $0.11.
| dYdX price prediction | Minimum price | Average price | Maximum price |
| dYdX price prediction July 2026 | $0.11 | $0.15 | $0.19 |
dYdX price prediction 2026
The price of 1 dYdX is expected to reach a minimum level of $0.08 by the end of 2026. Traders and investors can expect a maximum level of $0.4 and an average price of $0.3 if the bulls show up.
| dYdX price prediction | Minimum price | Average price | Maximum price |
| dYdX price prediction 2026 | $0.08 | $0.3 | $0.4 |
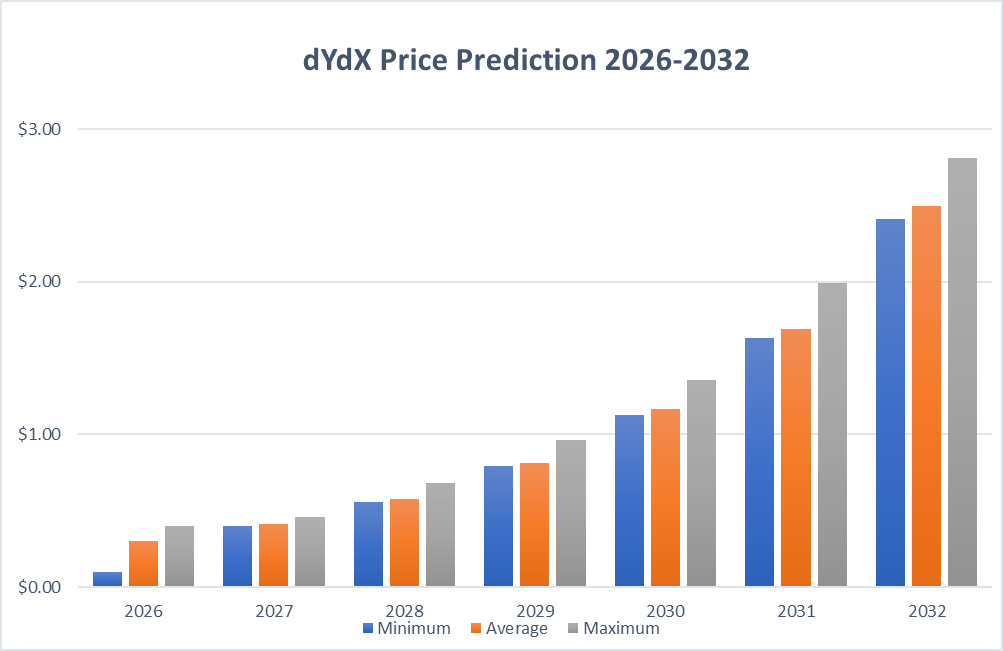
dYdX price predictions 2027-2032
| Year | Minimum price ($) | Average price ($) | Maximum price ($) |
| 2027 | 0.4018 | 0.4127 | 0.4586 |
| 2028 | 0.5562 | 0.5769 | 0.6804 |
| 2029 | 0.7911 | 0.8142 | 0.9637 |
| 2030 | 1.13 | 1.17 | 1.36 |
| 2031 | 1.63 | 1.69 | 1.99 |
| 2032 | 2.41 | 2.5 | 2.81 |
dYdX price prediction 2027
In 2027, dYdX could see its price range between a minimum of $0.4018 and a maximum of $0.4586. Traders can expect an average price of $0.4127 throughout the year.
dYdX price prediction 2028
For 2028, the price forecast indicates a minimum level of $0.5562 and a potential high of $0.6804, with the average settling around $0.5769.
dYdX price prediction 2029
Looking ahead to 2029, projections suggest a minimum price of $0.7911 and a maximum price of $0.9637 for dYdX, with an average price of $0.8142.
dYdX price forecast 2030
By 2030, the dYdX price is anticipated to range from a minimum of $1.13 to a maximum of $1.36, averaging around $1.17.
dYdX (dYdX) price prediction 2031
For 2031, the dYdX price is forecasted to potentially reach a minimum of $1.63, a maximum of $1.99, and an average trading value of $1.69.
dYdX Price Prediction 2032
Looking ahead to 2032, projections suggest a minimum price of $2.41 and a maximum price of $2.81 for dYdX, with an average price of $2.5.
dYdX market price prediction: Analysts’ dYdX price forecast
| Firm Name | 2026 | 2027 |
| Coincodex | $0.5397 | $0.4385 |
| Digital Coin Price | $0.34 | $0.46 |
Cryptopolitan’s dYdX (ethdYdX) price prediction
Per Cryptopolitan, in 2027, dYdX could see its price range between a minimum of $0.4018 and a maximum of $0.4586. Traders can expect an average price of $0.4127 throughout the year.
However, the future market potential for dYdX entirely depends on its buying demand, regulation, and investor sentiment in long-term holding.
dYdX historical price sentiment
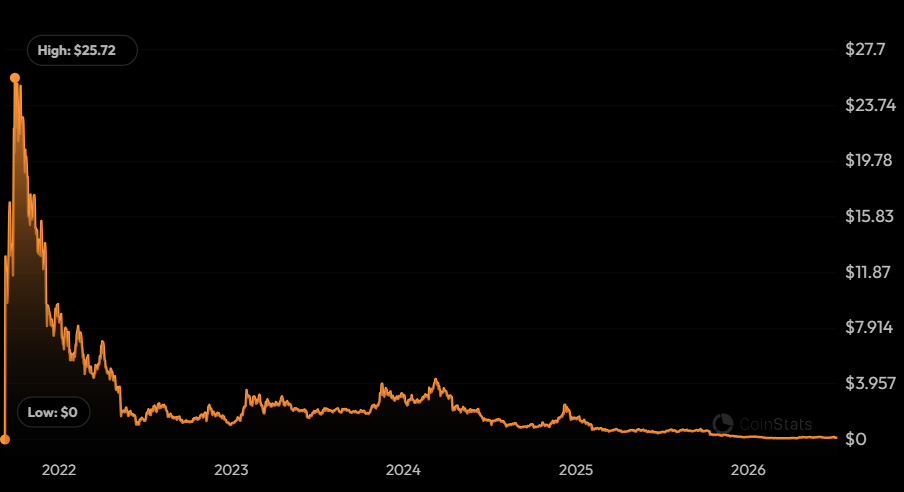
- dYdX price started trading in December 2023, hovering below $3.5.
- In January 2024, the price of dYdX faced a decline as it recorded a low of $2.4.
- However, in March, the dYdX surged exponentially and touched a high near $4.3.
- After that, dYdX initiated its bearish rally and hovered around $1 till November.
- However, dYdX soon recovered following Trump’s victory in the elections, skyrocketing toward $2.6 in December of 2024.
- Since then, dYdX has been declining and is consolidating below the $1 mark.
- By the end of April, dYdX price surged toward $0.68.
- In May, dYdX price surged toward $0.76 but it later declined toward $0.5 in early June.
- By the end of June, dYdX had declined toward $0.41.
- In July, the token surged toward $0.7 but failed to maintain buying demand and dropped below $0.6.
- In August, dYdX again surged toward $0.76 but declined later toward $0.6.
- By the end of September, dYdX price declined toward the low of $0.55.
- In October, the price of dYdX dropped further and touched a low below $0.3.
- By the end of November, the price of dYdX dropped below $0.23.
- By the end of December 2025, dYdX dropped toward the low of $0.163.
- In January 2026, the price of dYdX dropped toward the low of $0.12.
- By the end of February, dYdX price dropped below $0.085.
- In March, dYdX surged toward the high of $0.1. By the end of April, dYdX price surged and touched $0.2.
- In May, dYdX surged toward $0.18. However, it declined toward $0.12 by the end of June.


Read More