Key takeaways:
- AAVE price prediction for 2026 could reach a maximum value of $241.32.
- By 2029, AAVE could reach a maximum price of $477.67.
- In 2032, AAVE will range between $658.59 to $776.19.
Aave is a decentralized lending protocol on the Ethereum blockchain. It is known for its innovative financial solutions, such as flash loans, which allow users to borrow instantly without collateral, and dynamic interest rates that adapt to market conditions.
Participants in the Aave ecosystem can deposit their digital crypto assets back into liquidity pools to earn interest payments or obtain loans by borrowing funds without providing collateral. Aave’s governance and fee distribution are significantly driven by its native token, AAVE, enhancing its utility and value within the platform.
Having touched its ATH at $666.86 in May 2021, how much will AAVE be worth in 2026? Is AAVE worth holding?
Let’s get into the Aave technical analysis and predictions.
Overview
| Cryptocurrency | Aave |
| Ticker | AAVE |
| Current price | $112.80 |
| Market cap | $1.712B |
| Trading volume (24-h) | $447.99M |
| Circulating supply | 15.18M AAVE |
| All-time high | $666.86 on May 19, 2021 |
| All-time low | $26.02 on Nov 5, 2020 |
| 24-hour low | $109.73 |
| 24-hour high | $118.50 |
Aave price prediction: Technical analysis
| Metric | Value |
| Volatility (30-day Variation) | 5.26% (High) |
| 50-day SMA | $124.05 |
| 14-Day RSI | 45.37 (Neutral) |
| Sentiment | Bearish |
| Fear & Greed Index | 15 (Extreme Fear) |
| Green days | 14/30 (47%) |
| 200-Day SMA | $198.07 |
Aave 1-day price analysis
Key takeaways:
- AAVE is trying to recover after bouncing from the $106 area.
- The next important level is $116, which needs to be broken for the price to strengthen further.
- If $116 fails, price could slip back toward $110 or even retest $106.
AAVE trades at $112.81 on 13 March 2026, gaining about 1% on the daily session as the market rebounds from the recent swing low near $106. While price remains below the upper Bollinger Band near $121, the recovery above the mid-band suggests that bearish momentum is easing and the market is attempting to rebuild short-term structure.
Aave 1-day price chart
On the daily timeframe, AAVE has bounced from the $105–106 support zone, an area that previously halted the latest sell-off. The asset is now testing the 20-day SMA near $113, which currently acts as a short-term pivot level between continuation and rejection.
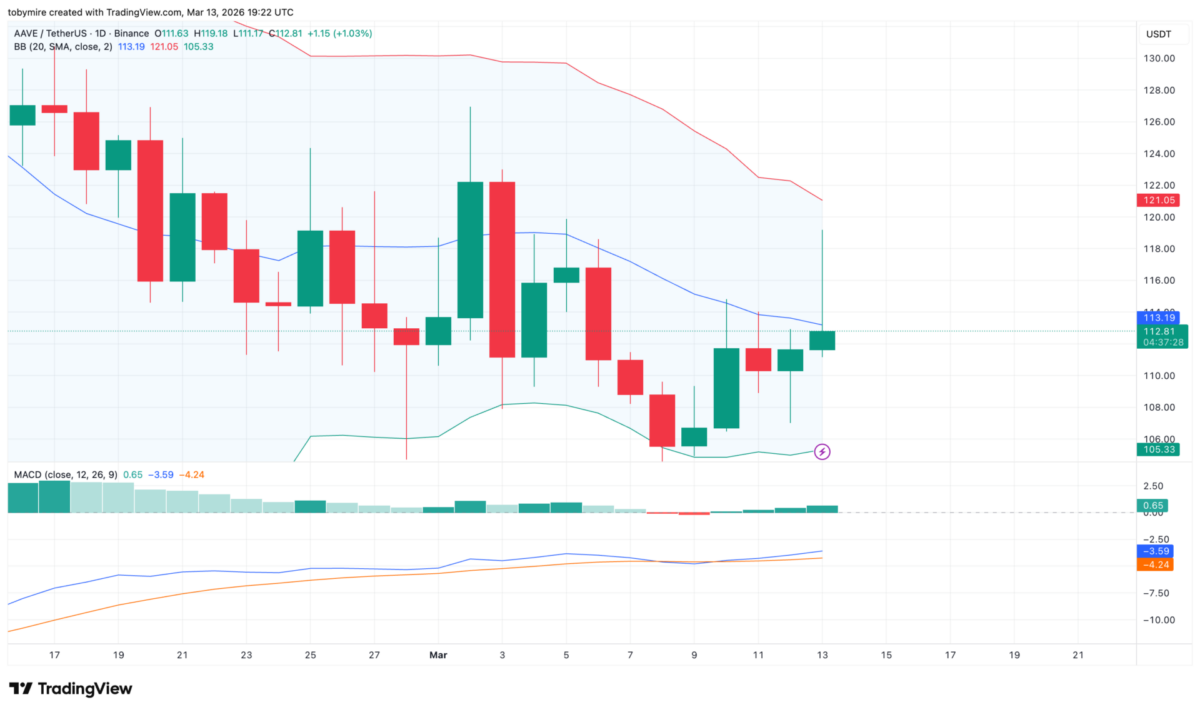
The MACD indicator is gradually curling upward, with the histogram turning slightly positive. This shift signals weakening downside pressure after the earlier decline from the $122–124 region, which represented a pullback of roughly 13–15% at its deepest point.
If buyers manage to maintain momentum above the mid-band area, price could attempt a move toward $116, followed by the upper Bollinger resistance near $121. However, failure to hold the $110–112 area could bring the $106 support back into focus.
Aave 4-hour price chart
On the 4-hour timeframe, AAVE recently rallied toward $116 before encountering selling pressure and pulling back to the $112–113 range. The asset is now trading close to the Alligator averages, which are beginning to compress, a typical signal that the market may be transitioning from directional movement to consolidation.
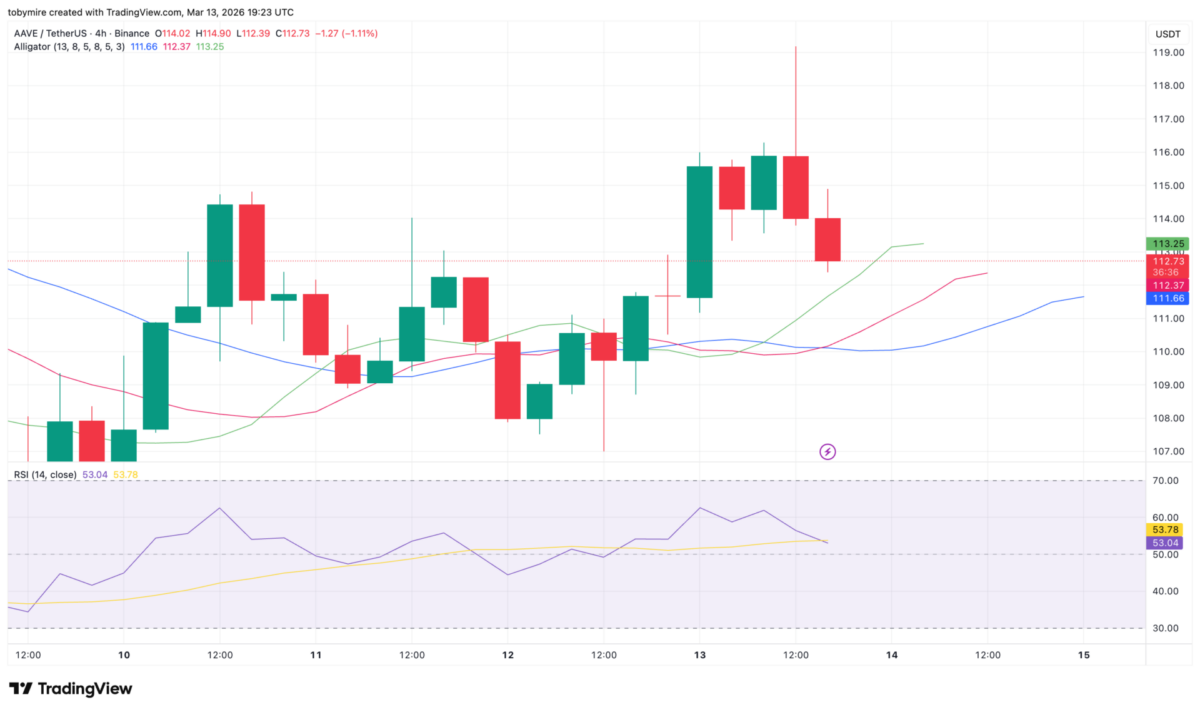
The RSI currently sits around 53, indicating balanced momentum with neither buyers nor sellers dominating in the immediate term. This neutral reading suggests the market may continue to consolidate before the next directional move emerges.
Immediate resistance is located near $116, while short-term support lies at $111–110. A sustained break above $116 could open the path toward $120–121, whereas a break below $110 would weaken the recovery and potentially trigger another test of $106.
Aave technical indicators: Levels and action
Daily simple moving average (SMA)
| Period | Value | Action |
|---|---|---|
| SMA 3 | $131.91 | SELL |
| SMA 5 | $119.81 | SELL |
| SMA 10 | $113.91 | SELL |
| SMA 21 | $117.62 | SELL |
| SMA 50 | $124.05 | SELL |
| SMA 100 | $149.84 | SELL |
| SMA 200 | $198.07 | SELL |
Daily exponential moving average (EMA)
| Period | Value | Action |
|---|---|---|
| EMA 3 | $117.43 | SELL |
| EMA 5 | $124.61 | SELL |
| EMA 10 | $136.55 | SELL |
| EMA 21 | $148.68 | SELL |
| EMA 50 | $166.71 | SELL |
| EMA 100 | $191.21 | SELL |
| EMA 200 | $215.00 | SELL |
AAVE price analysis conclusion
AAVE appears to be attempting a short-term recovery after testing key support, but the broader structure remains fragile until the asset can reclaim higher resistance levels. The $116 zone will be a crucial level to watch for confirmation of further upside.
Is AAVE a good investment?
Aave provides the essential infrastructure for lending and borrowing within DeFi, expanding beyond traditional applications into gaming, NFTs, and dApps. AAVE token plays a vital role in powering the platform, making it a strong choice for investors due to its proven market success and continuous development.
Where to buy AAVE?
AAVE tokens can be traded on centralized crypto exchanges. The most popular exchange to buy and trade Aave is Binance, one of the world’s largest cryptocurrency exchanges, offering a wide range of cryptocurrencies. Coinbase, ByBit, OKX, Kraken, and KuCoin also support AAVE.
Will Aave reach $500?
Aave (AAVE) can potentially reach $500 if it breaks through the current resistance levels and gains momentum from positive market sentiment and trends. AAVE had previously reached an ATH of $666.86; attaining $500 should be an achievable feat in the near term if market conditions align.
Does Aave have a good long-term future?
Aave has proven itself to be one of the most trusted and innovative platforms in DeFi over the years. It’s not just surviving, it’s evolving, with features like the GHO stablecoin and multichain support keeping it ahead of the curve. If DeFi continues to grow and mature, Aave isn’t just likely to stick around; it’ll probably be one of the key players shaping the future.
Recent news/opinion on AAVE
- AAVE is building V4 to remove liquidity fragmentation.
- Aave is the first lending protocol with over $1 billion in RWAs deposited.
Aave price prediction March 2026
Aave could reach a peak price of $144.56 by the end of the month. The minimum projected price for the coin is approximately $118.80, while the average is around $130.82.
| Aave price prediction | Potential Low | Average Price | Potential High |
| Aave price prediction March 2026 | $118.80 | $130.82 | $144.56 |
Aave price prediction 2026
By the end of Q1 2026, the value of AAVE is expected to range from a minimum of $120.99 to a maximum of $241.32, with an average of approximately $178.59.
| Aave price prediction | Potential Low | Average Price | Potential High |
| Aave price prediction 2026 | $120.99 | $178.59 | $241.32 |
Aave price prediction 2027-2032
| Year | Minimum Price | Average Price | Maximum Price |
| 2027 | $201.23 | $245.89 | $278.64 |
| 2028 | $292.71 | $344.24 | $378.15 |
| 2029 | $384.17 | $442.60 | $477.67 |
| 2030 | $475.65 | $541.96 | $577.17 |
| 2031 | $567.12 | $639.31 | $676.68 |
| 2032 | $658.59 | $737.66 | $776.19 |
AAVE price prediction for 2027
The AAVE protocol price prediction for 2027 indicates a continued rise, with a minimum price of $201.23, a maximum price of $278.64, and an average price of $245.89.
AAVE price prediction for 2028
Per expert analysis, the price of AAVE is expected to reach a minimum of $292.71 in 2028. The maximum expected price is $378.15, with an average trading price of $344.24.
AAVE price prediction for 2029
The AAVE forecast for 2029 estimates a minimum price of $384.17, a maximum price of $477.67, and an average price of $442.60.
AAVE price prediction for 2030
The AAVE price prediction for 2030 suggests a minimum price of $475.65 and an average price of $541.96. The maximum forecasted price is $577.17.
AAVE price prediction for 2031
The AAVE price prediction for 2031 anticipates further growth, resulting in a maximum price of $676.68. Based on expert analysis, investors can expect an average price of $639.31 and a minimum price of about $567.12.
AAVE price prediction for 2032
According to the AAVE price forecast for 2032, AAVE is expected to trade between a minimum price of $658.59 and a maximum price of $776.19, with an average trading price of $737.66.

AAVE market price prediction: Analysts’ AAVE price forecast
| Firm | 2026 | 2027 |
| Changelly | $329.94 | $493.94 |
| DigitalCoinPrice | $193.12 | $219.07 |
| CoinCodex | $331.97 | $272.97 |
In 2026, AAVE price predictions vary widely, with Changelly forecasting $329.94, DigitalCoinPrice expecting $193.12, and CoinCodex estimating an average price of $331.97.
An uptrend is expected moving into 2027, as Changelly predicts $493.94 and DigitalCoinPrice anticipates $219.07. However, the forecast from CoinCodex suggests a more cautious outlook, with the price potentially declining to $272.97.
Cryptopolitan’s Aave (AAVE) price prediction
According to our AAVE price forecast, the coin’s market price is expected to recapture a maximum value of $200 by Q1 2026. In 2029, the average AAVE price could surge to about $375.
Note that this prediction is not investment advice; seek independent professional consultation.
AAVE’s historic price sentiment
- Aave, originally launched as ETHLend in 2017, rebranded in 2018 and became a major player in DeFi. Its protocol went live in 2020, and by August, its total value locked had reached $1 billion.
- The coin reached an ATH of $666.86 in 2021 but slumped afterward. Aave v3 launched in March 2022, driving prices back up to $261 before fluctuating between $50 and $100 later that year.
- In 2023, AAVE saw steady growth, ending the year at $109. It continued its upward trend in 2024, peaking at $178 in September and hitting a high of $328 by December.
- AAVE hit $378 in January, dropped to $192.57 by February, then fluctuated between $152 and $238 in March. April saw a low of $115, while May reached $282 and June peaked at $319. The coin maintained an average price of $287.60.
- In August, AAVE ticked an average price of $310, and in September, the coin maintained a low of $255.66, a high of $330.94, and an average of $296.81. In October 2025, AAVE traded between $200.95 – $302.22.
- In November, AAVE maintained a trading range of $149.99 – $231.36. The coin traded at a high of $205 in December 2025 and closed the year at $146.
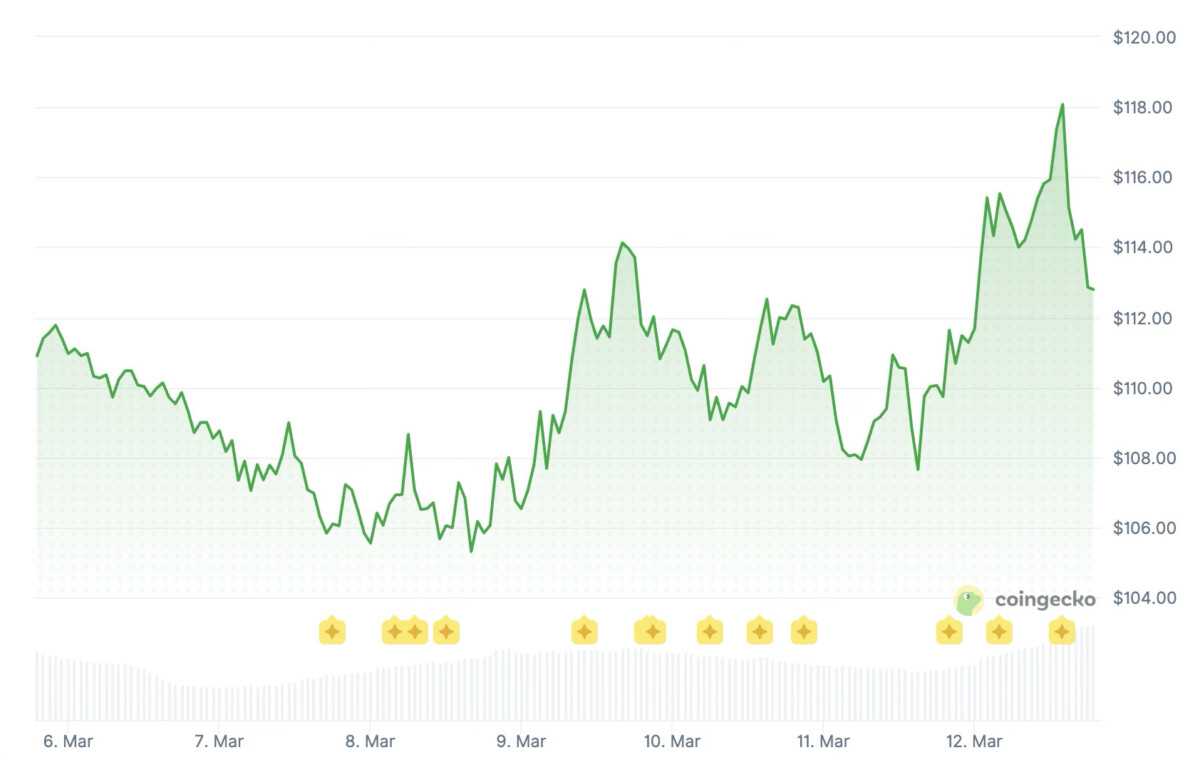
- In January 2026, AAVE traded between $121.02 and $179.28, and in February, the coin traded between $95 and $139. In March, the coin is trading between $109.73 and $118.50.


Read More