The post Bitcoin Price Analysis: Key Support and Resistance Levels to Watch Now appeared first on Coinpedia Fintech News
At the beginning of April, Bitcoin was trading at $82,539. Since then, it has dropped by more than 3.27%. But now, the price is showing early signs of a recovery as it slowly climbs back toward the important $80,000 level. At the same time, on-chain data shows signs of panic selling from short-term holders, which some analysts believe could actually be a long-term buying opportunity.
With major support and resistance levels now in focus, the market could be gearing up for a big move. Here’s what you need to know.
On-Chain Data Shows Panic Selling
The BTC Short-Term Holders SOPR (Spent Output Profit Ratio) indicator is currently moving downward. This means many short-term Bitcoin holders—those who have owned their coins for less than 155 days—are selling at a loss.
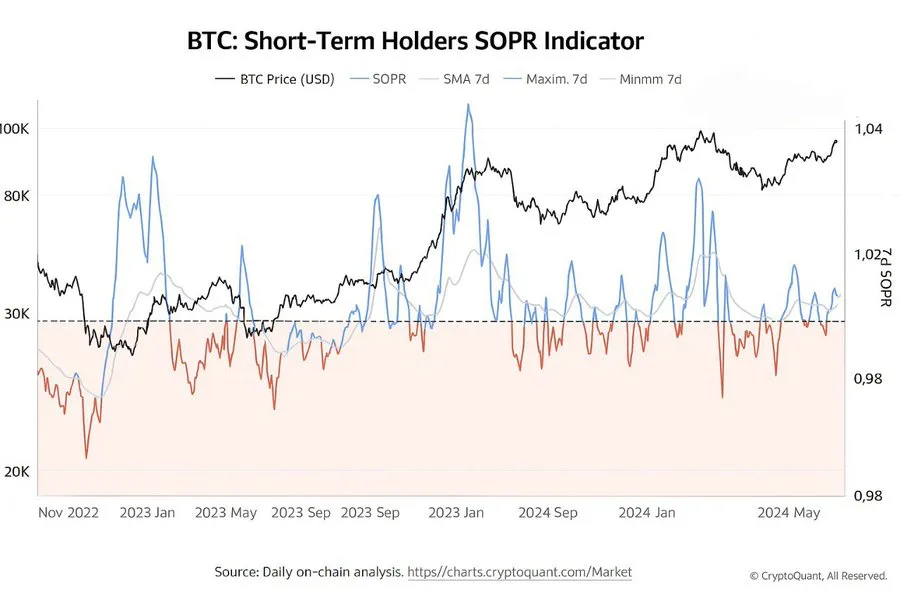
A SOPR value below 1 indicates that coins are being sold for less than what they were bought for. Right now, that’s exactly what’s happening. This trend is often a sign of fear or panic in the market.
Analysts See a Pattern: Past Dips Led to Highs
A crypto analyst who goes by FOUR Crypto Spaces on X compares the current drop in Bitcoin’s price to earlier dips—specifically the fall to $60K in 2024 and the dip to $26K in 2023. He believes these patterns show that market pullbacks are often followed by strong recoveries and new highs.
BTC Price Action: Key Resistance and Support Levels
Since yesterday, Bitcoin has gained nearly 1.82%. Its current price is $79,839—just 0.17% below the important $80,000 level.
.article-inside-link {
margin-left: 0 !important;
border: 1px solid #0052CC4D;
border-left: 0;
border-right: 0;
padding: 10px 0;
text-align: left;
}
.entry ul.article-inside-link li {
font-size: 14px;
line-height: 21px;
font-weight: 600;
list-style-type: none;
margin-bottom: 0;
display: inline-block;
}
.entry ul.article-inside-link li:last-child {
display: none;
}
A German analyst known as cb on X says that Bitcoin needs to break above $83,739 and $84,689 to continue moving higher. These are now seen as the next key resistance levels.
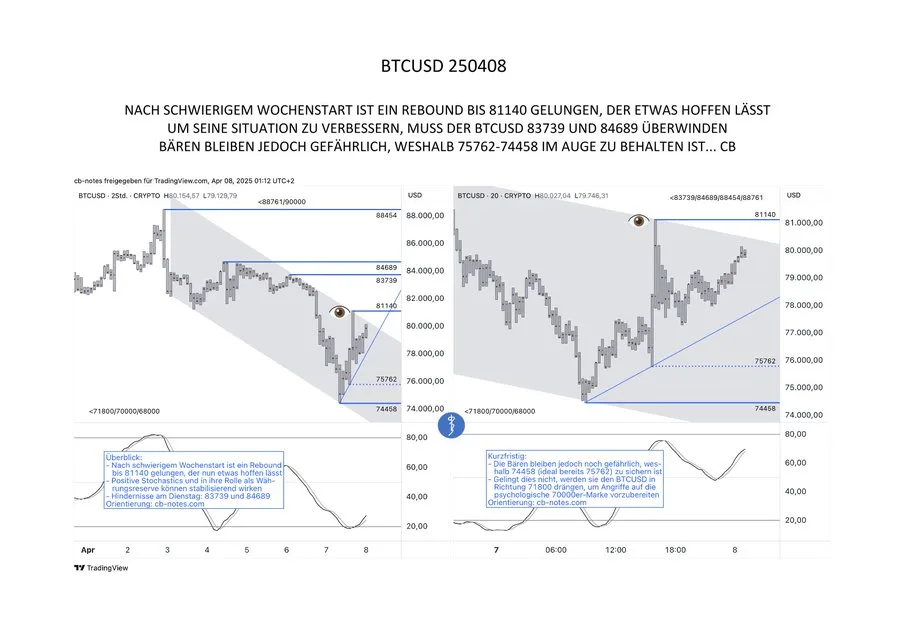
On April 6, Bitcoin dropped sharply to a low of $77,212, driven by heavy market volatility. According to cb, if BTC falls below the $75,762 to $74,458 range, it could lead to further losses.
Still Bearish? Maybe Not for Long
Although there’s still some downward pressure in the market, the recent bounce has given traders a reason to be optimistic. Some see this dip as a healthy correction and a possible setup for Bitcoin’s next upward run.
.article_register_shortcode {
padding: 18px 24px;
border-radius: 8px;
display: flex;
align-items: center;
margin: 6px 0 22px;
border: 1px solid #0052CC4D;
background: linear-gradient(90deg, rgba(255, 255, 255, 0.1) 0%, rgba(0, 82, 204, 0.1) 100%);
}
.article_register_shortcode .media-body h5 {
color: #000000;
font-weight: 600;
font-size: 20px;
line-height: 22px;
text-align:left;
}
.article_register_shortcode .media-body h5 span {
color: #0052CC;
}
.article_register_shortcode .media-body p {
font-weight: 400;
font-size: 14px;
line-height: 22px;
color: #171717B2;
margin-top: 4px;
text-align:left;
}
.article_register_shortcode .media-body{
padding-right: 14px;
}
.article_register_shortcode .media-button a {
float: right;
}
.article_register_shortcode .primary-button img{
vertical-align: middle;
width: 20px;
margin: 0;
display: inline-block;
}
@media (min-width: 581px) and (max-width: 991px) {
.article_register_shortcode .media-body p {
margin-bottom: 0;
}
}
@media (max-width: 580px) {
.article_register_shortcode {
display: block;
padding: 20px;
}
.article_register_shortcode img {
max-width: 50px;
}
.article_register_shortcode .media-body h5 {
font-size: 16px;
}
.article_register_shortcode .media-body {
margin-left: 0px;
}
.article_register_shortcode .media-body p {
font-size: 13px;
line-height: 20px;
margin-top: 6px;
margin-bottom: 14px;
}
.article_register_shortcode .media-button a {
float: unset;
}
.article_register_shortcode .secondary-button {
margin-bottom: 0;
}
}
Never Miss a Beat in the Crypto World!
Stay ahead with breaking news, expert analysis, and real-time updates on the latest trends in Bitcoin, altcoins, DeFi, NFTs, and more.
.subscription-options li {
display: none;
}
.research-report-subscribe{
background-color: #0052CC;
padding: 12px 20px;
border-radius: 8px;
color: #fff;
font-weight: 500;
font-size: 14px;
width: 96%;
}
.research-report-subscribe img{
vertical-align: sub;
margin-right: 2px;
}
var templateIds = “6”;
var listOfSubscribed = [];
function subscribed_popupmodal(template_id) {
var templateId = ‘6’;
getAllSubscriberCategoryList([templateId]);
var subcribemodal = window.parent.document.getElementById(‘subscribe-modal-design’);
if (subcribemodal) {
var modalContent = `


Never Miss a Beat in the Crypto World!
Stay informed and gain the edge you need to navigate the crypto world. Select your subscription now
`;
subcribemodal.innerHTML = modalContent;
}
subscribe_unsubscribe_status(template_id);
//getAllSubscriberCategoryList(template_id);
}
function toggleSubscription(subscription, template_id) {
var subscriptionCheckbox = document.getElementById(subscription + ‘_’ + template_id);
var li = document.getElementById(subscription + ‘Selected_’ + template_id);
if (subscriptionCheckbox.checked) {
li.classList.add(‘active’);
} else {
li.classList.remove(‘active’);
}
}
function getAllSubscriberCategoryList(getcategoryId) {
jQuery.ajax({
url: ‘https://coinpedia.org/wp-admin/admin-ajax.php’,
type: ‘GET’,
data: {
action: ‘subscribe_api_ajax_request’,
apiurl: ‘/app/email_newsletter/list’,
},
success: function(response) {
var result = JSON.parse(response.message);
if (result.status === true) {
var idstosubscribed = []
// Populate listOfSubscribed with subscribed category IDs
result.message.forEach(listofcategory => {
if (listofcategory.subscribe_status === 1) {
if (!listOfSubscribed.includes(listofcategory._id)) {
listOfSubscribed.push(listofcategory._id);
}
if (!idstosubscribed.includes(listofcategory.news_cp_category_row_id)) {
idstosubscribed.push(listofcategory.news_cp_category_row_id);
}
}
});
idstosubscribed.forEach(id => {
var subscribeButton = document.getElementById(‘subscribe_’ + id);
var unsubscribeButton = document.getElementById(‘unsubscribe_’ + id);
if (subscribeButton && unsubscribeButton) {
subscribeButton.style.display = ‘none’;
unsubscribeButton.style.display = ‘block’;
var showDownloadReport = document.getElementById(‘download_report’);
if (showDownloadReport) {
showDownloadReport.style.display = ‘block’;
}
}
});
}
},
error: function(xhr, status, error) {
console.error(‘Error:’, error);
}
});
}
function subscribe_unsubscribe_status(getcategoryId) {
var elementTounsubscribe = parent.document.getElementById(‘unsubscribe_’ + getcategoryId);
var elementTosubscribe = parent.document.getElementById(‘subscribe_’ + getcategoryId);
jQuery.ajax({
url: ‘https://coinpedia.org/wp-admin/admin-ajax.php’,
type: ‘POST’,
data: {
action: ‘subscribe_api_ajax_request’,
apiurl: ‘/app/email_newsletter/list?category_row_id=’ + getcategoryId,
},
success: function(response) {
var result = JSON.parse(response.message);
if (result.status === true) {
parent.jQuery(‘.skeliton-loader-block’).hide();
var hasSubscribeStatusOne = false;
result.message.forEach(subscribeStatus => {
if (listOfSubscribed.includes(subscribeStatus._id) && subscribeStatus.subscribe_status === 1) {
hasSubscribeStatusOne = true;
}
if (subscribeStatus.notification_type === 3) {
parent.document.getElementById(‘monthlySelected_’ + getcategoryId).style.display = ‘block’;
parent.document.getElementById(‘monthly_’ + getcategoryId).setAttribute(‘data-id’, subscribeStatus._id);
if (subscribeStatus.subscribe_status === 1) {
parent.document.getElementById(‘monthly_’ + getcategoryId).checked = true;
}
} else if (subscribeStatus.notification_type === 2) {
parent.document.getElementById(‘weeklySelected_’ + getcategoryId).style.display = ‘block’;
parent.document.getElementById(‘weekly_’ + getcategoryId).setAttribute(‘data-id’, subscribeStatus._id);
if (subscribeStatus.subscribe_status === 1) {
parent.document.getElementById(‘weekly_’ + getcategoryId).checked = true;
}
} else if (subscribeStatus.notification_type === 1) {
parent.document.getElementById(‘dailySelected_’ + getcategoryId).style.display = ‘block’;
parent.document.getElementById(‘daily_’ + getcategoryId).setAttribute(‘data-id’, subscribeStatus._id);
if (subscribeStatus.subscribe_status === 1) {
parent.document.getElementById(‘daily_’ + getcategoryId).checked = true;
}
}
if (subscribeStatus.subscribe_status === 1) {
listOfSubscribed.push(subscribeStatus._id);
}
});
if (hasSubscribeStatusOne) {
elementTosubscribe.style.display = ‘none’;
elementTounsubscribe.style.display = ‘block’;
} else {
elementTosubscribe.style.display = ‘block’;
elementTounsubscribe.style.display = ‘none’;
}
}
},
error: function(xhr, status, error) {
console.error(‘Error:’, error);
}
});
}
function logSelectedSubscriptions(categoryid) {
var unsubscribemodal = document.querySelector(‘.unsubscribed-popup-modal .modal’);
var subscribedmodal = document.querySelector(‘.subscribed-popup-modal .modal’);
unsubscribemodal.innerHTML=”;
subscribedmodal.innerHTML=”;
var selectedSubscriptions = [];
var storeCheckedId = [];
var checkboxes = document.querySelectorAll(‘#subscription-options-‘ + categoryid + ‘ input[type=”checkbox”]’);
var errorMessage = document.getElementById(‘error-message-select’);
// Use a Set to handle unique data-ids
var uniqueSubscribedIds = new Set(listOfSubscribed);
checkboxes.forEach(function(checkbox) {
var dataId = parseInt(checkbox.getAttribute(‘data-id’));
if (checkbox.checked) {
selectedSubscriptions.push(checkbox.id);
storeCheckedId.push(dataId);
} else {
uniqueSubscribedIds.delete(dataId); // Remove unchecked data-id
}
});
// Update listOfSubscribed with unique values
listOfSubscribed = Array.from(uniqueSubscribedIds);
var selectedSubscriptionsString = selectedSubscriptions.join(‘, ‘);
var concatinateSubscribeId = […new Set(storeCheckedId.concat(listOfSubscribed))];
var categoryData = {
‘subscribed_categories’: concatinateSubscribeId
};
var requestSubscriberData = {
action: ‘handle_dynamic_api_request_with_headers’,
security: ‘d9649188c0’,
endpoint: ‘/app/email_newsletter/update_categories’,
token: ”,
data: categoryData
};
jQuery.ajax({
url: ‘https://coinpedia.org/wp-admin/admin-ajax.php’,
type: ‘POST’,
data: requestSubscriberData,
beforeSend: function(xhr) {
xhr.setRequestHeader(‘X-Requested-With’, ‘XMLHttpRequest’);
},
success: function(response) {
try {
response = response.data;
if (storeCheckedId.length === 0) {
var unsubcribedPopUpmodal =
`

You’ve Unsubscribed Successfully
We’re sorry to see you go! Your subscription has been canceled. If you change your mind, you can re-subscribe anytime. Thank you for being part of our community!
`;
unsubscribemodal.innerHTML = unsubcribedPopUpmodal;
document.querySelector(‘#subscribe-modal-design .modal’).style.display = ‘none’;
unsubscribemodal.style.display = ‘block’;
unsubscribemodal.classList.remove(‘hide’);
unsubscribemodal.classList.add(‘show’);
document.getElementById(‘subscribe_’ + categoryid).style.display = ‘block’;
document.getElementById(‘unsubscribe_’ + categoryid).style.display = ‘none’;
var showDownloadReport = document.getElementById(‘download_report’);
if (showDownloadReport) {
showDownloadReport.style.display = ‘none’;
}
} else {
var subscribedPopupModal =
`

Thank you for subscribing!
Thank you for subscribing to our crypto and blockchain newsletter! You’ll now receive the latest news, insights, and updates straight to your inbox. Welcome to our community!
`;
let selectedSubscriptionsArray = selectedSubscriptionsString.split(‘,’);
let subscribedCategories = selectedSubscriptionsArray.map(subscription => subscription.split(‘_’)[0]);
let subscribedCategoriesString = subscribedCategories.join(‘, ‘);
subscribedmodal.innerHTML = subscribedPopupModal;
if (document.getElementById(‘selectidname’)) {
document.getElementById(‘selectidname’).textContent = subscribedCategoriesString;
}
document.querySelector(‘#subscribe-modal-design .modal’).style.display = ‘none’;
subscribedmodal.style.display = ‘block’;
subscribedmodal.classList.remove(‘hide’);
subscribedmodal.classList.add(‘show’);
document.getElementById(‘subscribe_’ + categoryid).style.display = ‘none’;
document.getElementById(‘unsubscribe_’ + categoryid).style.display = ‘block’;
var showDownloadReport = document.getElementById(‘download_report’);
if (showDownloadReport) {
showDownloadReport.style.display = ‘block’;
}
}
} catch (e) {
console.error(‘Error parsing response:’, e);
}
},
});
}
function closeModal(template_id) {
var modalId = template_id;
var modal = document.querySelector(‘#’ + modalId); // Using querySelector to find the modal
if (modal) {
modal.classList.add(‘hide’);
modal.classList.remove(‘show’);
setTimeout(function() {
modal.style.display = ‘none’;
}, 500);
} else {
console.warn(‘Modal not found:’, modalId);
}
}
function closeunsubscribemodal() {
var unsubscribemodal = document.querySelector(‘.unsubscribed-popup-modal .modal’);
if (unsubscribemodal) {
unsubscribemodal.classList.add(‘hide’);
unsubscribemodal.classList.remove(‘show’);
}
setTimeout(function() {
unsubscribemodal.style.display = ‘none’;
}, 500);
}
function closesubscribemodal() {
var subscribedmodal = document.querySelector(‘.subscribed-popup-modal .modal’);
setTimeout(function() {
subscribedmodal.style.display = ‘none’;
}, 500);
if (subscribedmodal) {
subscribedmodal.classList.add(‘hide’);
subscribedmodal.classList.remove(‘show’);
}
}
function withoutLoginClicked(withoutlogin_id) {
localStorage.setItem(‘subscribe_without_Login’, ‘true’);
localStorage.setItem(‘subscribe_clicked_id’, withoutlogin_id);
}
document.addEventListener(‘DOMContentLoaded’, function() {
const subscribewithoutData = localStorage.getItem(‘subscribe_without_Login’);
const subscribe_clicked_cat_id = localStorage.getItem(‘subscribe_clicked_id’);
// Function to get cookies
function getCookie(name) {
let value = “; ” + document.cookie;
let parts = value.split(“; ” + name + “=”);
if (parts.length == 2) return parts.pop().split(“;”).shift();
}
// Get user token from cookies
const userToken = getCookie(‘user_token’);
if (subscribewithoutData === ‘true’ && userToken) {
// Call the modal function with the category ID
subscribed_popupmodal(subscribe_clicked_cat_id);
// Remove the flag and category ID from localStorage
localStorage.removeItem(‘subscribe_without_Login’);
localStorage.removeItem(‘subscribe_clicked_id’);
}
});
/************************** update susbcriber content **************************** */
function initializeSubscriptionButton() {
var initialListItems = document.querySelectorAll(‘.subscription-options input[type=”checkbox”]’);
initialListItems.forEach(function(item) {
console.log(item.checked, ‘Initial Checkbox checked status’);
});
var listItems = document.querySelectorAll(‘.subscription-options li’);
if (listItems.length === 0) return;
var anyActive = false;
listItems.forEach(function(item) {
var checkbox = item.querySelector(‘input[type=”checkbox”]’);
if (checkbox) {
if (checkbox.checked) {
item.classList.add(‘active’);
anyActive = true; // Set anyActive to true
} else {
item.classList.remove(‘active’); // Remove ‘active’ class if checkbox is unchecked
}
}
});
}
function updateButtonText(anyActive) {
var subscribeButtonSpan = document.querySelector(‘.subscribe-submit .changeBtnText’);
if (subscribeButtonSpan) {
if (anyActive) {
subscribeButtonSpan.textContent = ‘Subscribe Now’;
} else {
subscribeButtonSpan.textContent = ‘Unsubscribe’;
}
}
}
function updateSubscriptionButton() {
var listItems = document.querySelectorAll(‘.subscription-options li’);
if (listItems.length === 0) return;
var anyActive = false;
listItems.forEach(function(item) {
var checkbox = item.querySelector(‘input[type=”checkbox”]’);
if (checkbox) {
if (checkbox.checked) {
item.classList.add(‘active’);
anyActive = true; // Set anyActive to true
} else {
item.classList.remove(‘active’); // Remove ‘active’ class if checkbox is unchecked
}
}
});
// Update the button text based on whether any list item has the ‘active’ class
updateButtonText(anyActive);
}
document.addEventListener(‘click’, function(event) {
var clickedItem = event.target.closest(‘.subscription-options li’);
if (clickedItem) {
var checkbox = clickedItem.querySelector(‘input[type=”checkbox”]’);
if (checkbox) {
checkbox.checked = !checkbox.checked;
updateSubscriptionButton();
}
}
});
FAQs
As per Coinpedia’s BTC price prediction, 1 BTC could peak at $169,046 this year if the bullish sentiment sustains.
With increased adoption, the price of 1 Bitcoin could reach a height of $610,646 in 2030.
As per our latest BTC price analysis, Bitcoin could reach a maximum price of $5,148,828.
By 2050, a single BTC price could go as high as $12,436,545.
The post Bitcoin Price Analysis: Key Support and Resistance Levels to Watch Now appeared first on Coinpedia.org.


Read More