Key takeaways
- Bitcoin price faces mixed market sentiment around the $64K region.
- Our BTC price prediction expects BTC price to reach $100K by the end of 2024 due to bullish sentiment following halving event.
- By 2030, BTC might touch $270,593 following increased institutional adoption.
Bitcoin’s price has once again rebounded from the $60K mark, marking the third bullish reversal this year. This pattern, supported by various bullish indicators and technical data, suggests a potential trend reversal, reigniting predictions that Bitcoin could reach $100,000.
As the second quarter closes at a subdued pace, the onset of Q3 sees a breakout rally with ambitions to quickly exceed $70K. Rising from the vital $60K support level, there is growing hope in the market about the onset of a sustained bull market.
CryptoQuant’s CEO, Ki Young Ju, noted in a recent X post that in 2020, Bitcoin stayed around the $10,000 mark for six months amid high on-chain activity, before surging to $64,000 in 2021. Observing 2024, a similar pattern is emerging, with daily additions of $1 billion to new whale wallets.
However, despite mixed spot Bitcoin ETF flow, the US Bitcoin sentiment develops a bullish trend as BTC HODLers are anticipating a continuous uptrend beyond $75,000. This has led analysts to think: Will this lead Bitcoin price past $100,000?
The current BTC trading sentiment is bullish as Bitcoin traded at its highest point in pre-halving rally. Since 2024 is bullish for the crypto market, anticipation is that the BTC price could hit $100K during this season.
As Bitcoin on-chain activities surge, questions arise, such as: “Does Bitcoin have the potential of hitting the $100K mark?” or “Will Bitcoin ever go up?” or “Where will Bitcoin be in 5 years?” Let’s answer them using our Bitcoin price prediction.
Overview
| Cryptocurrency | Bitcoin |
| Token | BTC |
| Price | $62,812 |
| Market Cap | $1,238,914,422,643 |
| Trading Volume | $22,318,495,561 |
| Circulating Supply | 19,719,062 |
| All-time High | $73,750, March 14, 2024 |
| All-time Low | $0.04865, Jul 15, 2010 |
| 24 High | $63,700 |
| 24 Low | $61,351 |
Bitcoin Price Prediction: Technical Analysis
| Metric | Value |
| Sentiment | Neutral |
| Price Prediction | $83,774 (Increase: 33.55%) |
| Volatility | 4.87% |
| 50-Day SMA | $66,428 |
| 200-Day SMA | $57,935 |
| 14-Day RSI | 44.01 |
| Fear & Greed Index | 53 (Neutral) |
| Green Days | 16/30 (53%) |
Bitcoin Price Analysis
BTC price attempted for a surge above $64K but faced a decline
TL; DR Breakdown
- BTC price analysis shows that Bitcoin faced a bearish pattern as it struggled to surge above $64K
- Resistance for BTC is present at $64,547
- Support for BTC/USD is present at $62,075
The BTC price analysis for 1 July confirms that bears sparked a solid selling pressure as BTC price plunged buying confidence after rejecting the $64K resistance. However, the price is aiming for a retest of the resistance line again.
BTC price analysis 1-day chart: Bitcoin price struggles in validating a clear trend
Analyzing the daily price chart of Bitcoin, BTC’s price faced a minor selling pressure as the price failed to surge above $64K. However, the BTC price is facing a surge in buying demand as bears struggle in initiating further corrections. The 24-hour volume has surged to $8.8 million, showing an increased interest in trading activity today. BTC price is currently trading at $62,882, increasing by over 0.4% in the last 24 hours.

BTC/USD Chart On TradingView
The RSI-14 trend line has surged from its previous level and currently trades below the midline at 44, hinting that a bearish pressure is still on the edge. The SMA-14 level suggests volatility in the next few hours.
BTC/USD 4-hour price chart: Bears aim for an immediate correction below moving averages
The 4-hour Bitcoin price chart suggests that bears are strengthening their position as they are aiming to hold the price below the EMA trend lines. However, bulls are maintaining buying confidence as the price consolidates above EMA20 trend line.

BTC/USD Chart On TradingView
The BoP indicator is trading in a negative region at 0.94, showing that short-term sellers are taking a chance to accelerate a downward trend.
However, the MACD trend line has formed bullish candles above the signal line and the indicator aims for a positive momentum, strengthening long-position holders’ confidence.
Bitcoin Technical Indicators: Levels And Action
Daily Simple Moving Average (SMA)
| Period | Value | Action |
| SMA 3 | $61,433 | BUY |
| SMA 5 | $61,373 | BUY |
| SMA 10 | $62,725 | BUY |
| SMA 21 | $64,950 | SELL |
| SMA 50 | $66,428 | SELL |
| SMA 100 | $66,028 | SELL |
| SMA 200 | $57,935 | BUY |
Daily Exponential Moving Average (EMA)
| Period | Value | Action |
| EMA 3 | $61,391 | BUY |
| EMA 5 | $61,743 | BUY |
| EMA 10 | $62,807 | BUY |
| EMA 21 | $64,461 | SELL |
| EMA 50 | $65,503 | SELL |
| EMA 100 | $63,983 | SELL |
| EMA 200 | $58,049 | BUY |
What to expect from BTC price analysis next?
The hourly price chart confirms that Bitcoin attempts to drop below the immediate support line; however, bulls are eyeing for further recovery rally in the upcoming hours. If BTC’s price successfully holds its momentum above $64,547, it will fuel a bullish rally to $67,372.

BTC/USD Chart On TradingView
If bulls fail to initiate a surge, BTC price may drop below the immediate support line at $62,075, which may begin a bearish trend to $58,562.
Recent News
- U.S. spot bitcoin exchange-traded funds experienced another day of inflows, attracting $21.52 million on 27 June. Leading the gains was Fidelity’s FBTC, which saw an increase of $19 million.
Bitcoin Price Prediction July 2024
June proved to be a volatile month for Bitcoin, characterized by significant price fluctuations. Regrettably, the price trended downward, with bears driving a decrease of 7.12%. Is there hope for a turnaround in July?
June was a rollercoaster month for Bitcoin, with its price peaking at $72,000 and dipping to just over $58,000. Ultimately, sellers gained the upper hand, resulting in an overall price decline of approximately 7%.
However, the BTC trading volume is surging, and the market is experiencing a widespread rise in bullish sentiment due to the Ethereum ETF, which suggests an upward trend. However, the current retest phase indicates that bullish momentum is lacking.
Bitcoin price might attempt to surge toward $74,000 from its recent low, and this number be pushed further, at least $78,000, if the strong downwards pressures are not seen. However, on the bearish side, we might see a rejection, leading to a consolidation within $60K-$55K.
| Bitcoin Price Prediction | Potential Low | Potential Average | Potential High |
| Bitcoin Price Prediction July 2024 | $58,000 | $70,000 | $78,000 |
Bitcoin Price Prediction 2024
Historically, Bitcoin usually carries as the significant crypto coin in the year following a halving and it is expected that this will push up its price. Bitcoin miners might play a crucial role in holding bullish sentiment for future price movements.
Bitcoin spot ETFs are projected to be a key driver of Bitcoin prices and the broader cryptocurrency market in 2024. According to Glassnode, approximately $70 billion of new capital is expected to flow into the crypto market through these newly launched Bitcoin ETFs.
Furthermore, there is an increasing bullish sentiment that the base interest rates could be cut in the US, and thus, help to further the upward movement of Bitcoin. An outcome of which the 2024 year could be positive for Bitcoin, with its crypto-price perhaps touching $110,000 in the highest and the low could be around $48,000.
| Bitcoin Price Prediction | Potential Low | Potential Average | Potential High |
| Bitcoin Price Prediction 2024 | $48,000 | $67,000 | $110,000 |
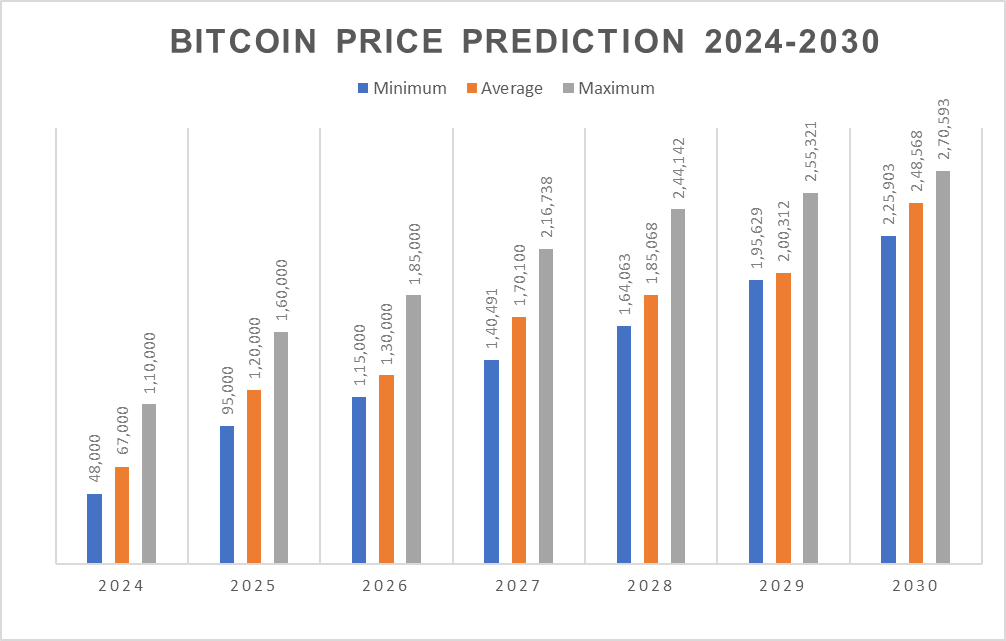
Bitcoin Price Predictions 2025-2030
| Year | Minimum Price | Average Price | Maximum Price |
| 2025 | $95,000 | $120,000 | $160,000 |
| 2026 | $115,000 | $130,000 | $185,000 |
| 2027 | $140,491 | $170,100 | $216,738 |
| 2028 | $164,063 | $185,068 | $244,142 |
| 2029 | $195,629 | $200,312 | $255,321 |
| 2030 | $225,903 | $248,568 | $270,593 |
Bitcoin Price Prediction 2025
The Bitcoin Halving event’s impact is expected to last into 2025, potentially holding the Bitcoin price above the $100,000 mark. If the global economy strengthens and inflation stabilizes at 2%, interest rates could be reduced by 2025.
Clearer crypto regulations could boost BTC investor confidence, leading to more buying demand amid scarcity due to halving.
Following the halving event over the next 12-18 months, BTC price is expected to surge toward $160,000, with a minimum price of $95,000.
Bitcoin Price Prediction 2026
Bitcoin might witness a slow growth after 2025’s halving surge, resulting in a surge in selling pressure. However, more financial products including a surge in ETF demand might hold BTC price within a bullish region. We might see a maximum price of $185,000, with a minimum price of $115,000 and average price of $130,000. However, BitMEX Ceo Arthur Hayes predicted the BTC price to touch $700K in 2026.
Bitcoin Price Prediction 2027
Based on detailed technical analysis of past Bitcoin price data, it is projected that in 2027, Bitcoin could see a minimum price of $140,491. The potential maximum price is estimated to be $216,738, with an average value of $170,100.
Bitcoin Price Prediction 2028
By 2028, Bitcoin’s price is expected to possibly reach a low of $164,063. Maximum price projections are as high as $244,142, with the price averaging about $185,068 for the year.
Bitcoin Price Forecast 2029
Projections for 2029 suggest that Bitcoin could be valued at a minimum of $195,629. The price may peak at as much as $255,321, with an average throughout the year expected to be around $200,312.
Bitcoin (BTC) Price Prediction 2030
For the year 2030, the forecast suggests that the price of Bitcoin could start at a minimum of $225,903 and potentially rise to a maximum of $270,593. The average price is anticipated to stabilize at about $248,568 throughout the year.
Read more: Bitcoin into the last april weekend 2024 – btc halving chronicles
Bitcoin Market Price Prediction: Analysts’ BTC Price Forecast
| Firm Name | 2024 | 2025 |
| Gov.Capital | $74,790 | $121,352 |
| DigitalCoinPrice | $88,755 | $130,963 |
| Trading Beasts | $102,632 | $154,235 |
- CoinCodex predicts Bitcoin’s price could reach $158,827 by 2025, using the Bitcoin Rainbow Chart based on past volatility and the cyclical nature of Bitcoin Halving events.
- Cathie Wood of Ark Invest forecasts Bitcoin may hit $600,000 by 2030, with a potential rise to $1.5 million in her bull case scenario after Bitcoin ETFs approval.
- Bloomberg Intelligence’s Mike McGlone estimates Bitcoin will reach $100,000 by 2030, attributing the increase to rising demand and BTC scarcity.
- Robert Kiyosaki predicts Bitcoin price to touch $120,000 by the end of 2024.
Cryptopolitan’s Bitcoin (BTC) Price Prediction
At Cryptopolitan, we are bullish on Bitcoin’s future price as the historical market sentiment is extremely impressive. By the end of 2024, Bitcoin might record a maximum price of $110,000, with a minimum price of $48,000 and an average price of $65,000.
However, the future market potential for Bitcoin entirely depends on its buying demand, regulation and investor sentiment in long-term holding.
We expect Bitcoin price to create a high of $110,000 by the end of 2024.
Bitcoin Historical Price Sentiment
- Satoshi Nakamoto created Bitcoin in 2009, marking the first use of blockchain technology.
- Bitcoin was initially of little value, gaining significant traction and hitting over $15,000 during the 2017 boom, with further highs reached in 2019 and 2021.
- In 2021, Bitcoin peaked at $68,789.63 but dropped to $15,760 by December 2022 amid economic pressures including inflation and geopolitical conflicts.
- By April 10, 2023, Bitcoin’s price surged 83%, breaking the $30,000 resistance level.
- Throughout mid-2023, Bitcoin’s value hovered around $30,000, nearly reaching $32,000 due to positive market sentiments and potential ETF approvals.
- Bitcoin experienced a significant price drop in mid-August 2023, falling to $25,000 and remained volatile with October prices fluctuating between $26,000 and $29,500.
- Bitcoin closed 2023 above $42,000, a 155% increase from the year’s start.
- Early 2024 saw Bitcoin rise above $45,000 in anticipation of multiple ETF approvals, despite a brief dip below $40,000 following the ETF approval.
- Bitcoin’s price surged in February 2024, breaking its previous all-time high from 2021 on March 5th, reaching over $70,000 by March 8th, and setting a new high of $73,750.07 on March 14th.
- However, in April, the BTC price dropped below $60K.
- Later in May, the price of bitcoin surged and knocked the $70K level.
- However, in recent weeks of June, BTC price declined heavily and touched a new monthly low of $58K.
- In 2024, Bitcoin casino has emerged as a modern and innovative platform for gaming enthusiasts, offering the benefits of anonymity, security, and fast transactions.


Read More