Key takeaways:
- ICP is expected to attain a maximum price of $4.57 in 2026.
- Internet Computer protocol price forecast for 2029 expects the token to reach a peak price of $12.20.
- By 2032, the price of Internet Computer might reach a maximum of $19.82.
Internet Computer (ICP) is a groundbreaking blockchain network developed by the DFINITY Foundation. It aims to extend the functionality of the internet, enabling it to host backend software and transforming it into a global, decentralized computer. Internet computer blockchain incorporates advanced cryptography and innovative technology to provide scalable, efficient, and secure decentralized applications (dApps).
Given its robust technology and expanding utility, the Internet Computer blockchain’s future price prospects look promising. As more developers build on the platform and adoption increases, ICP token demand will likely rise.
Does Internet Computer coin have a future? How much will Internet Computer coin cost in 2026? Will ICP reach $1000?
Let’s get into the current price analysis and predictions.
Overview
| Cryptocurrency | Internet Computer |
| Token | ICP |
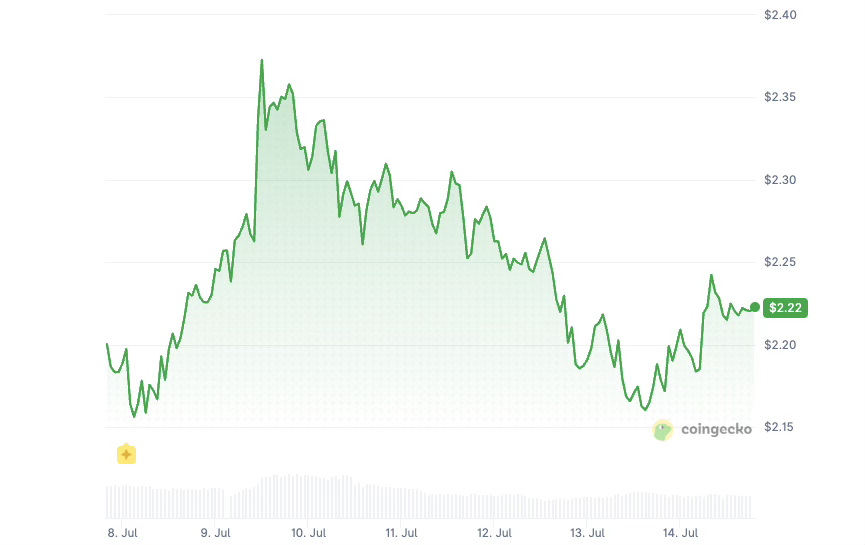
| Price | $2.22 |
| Market Cap | $1.232B |
| Trading Volume | $31.176M |
| Circulating Supply | 554.41M ICP |
| All-time High | $750.73 (May 10, 2021) |
| All-time Low | $2.02 (Feb 24, 2026) |
| 24-h High | $2.25 |
| 24-h Low | $2.17 |
Internet Computer Network technical analysis
| Metric | Value |
| Volatility (30-day period) | 4.09% (Medium) |
| 14-Day RSI | 43.02 (Neutral) |
| 50-Day SMA | $2.37 |
| Sentiment | Bearish |
| Fear & Greed Index | 22 (Extreme Fear) |
| Green Days | 13/30 (43%) |
| 200-Day SMA | $2.63 |
Internet Computer price analysis
TL;DR Breakdown
- The daily momentum is fading below $2.21.
- Short-term structure favors sellers below $2.24.
- A break under $2.15 could send ICP toward $2.05.
ICP 1-day price analysis
On the 1-day chart for July 15, ICP trades near $2.20, down 1.17%, and slightly below the Bollinger midpoint at $2.21. The rejection from $2.35 has erased roughly 6.5%, while fading MACD histogram bars show that the recent recovery is losing strength.
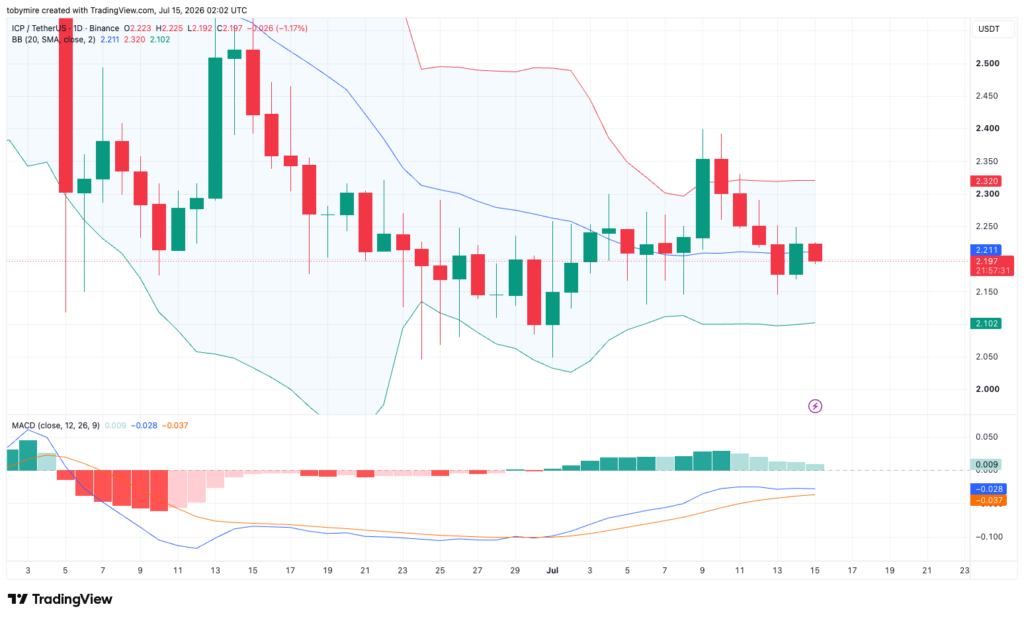
Holding $2.10-$2.15 could preserve the range, but a break below it would expose $2.05. Bulls need to reclaim $2.21-$2.25 before targeting $2.32 again.
ICP 4-hour price analysis
ICP sits below all three Alligator averages at $2.21-$2.22, confirming a mild bearish shift. RSI at 43.9 remains below neutral, showing weak demand without oversold conditions.
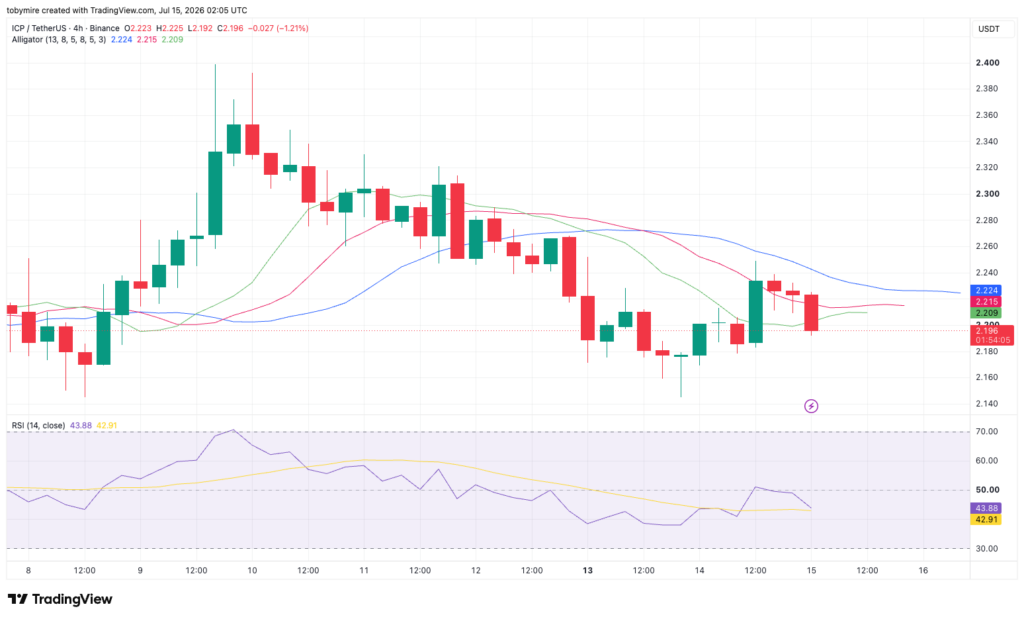
Immediate support lies around $2.18-$2.16; reclaiming $2.22-$2.24 could restart the recovery toward $2.28, while losing support would likely extend the decline.
ICP technical indicators: Levels and action
Daily simple moving average (SMA)
| Period | Value | Action |
|---|---|---|
| SMA 3 | $2.21 | SELL |
| SMA 5 | $2.26 | SELL |
| SMA 10 | $2.24 | SELL |
| SMA 21 | $2.20 | BUY |
| SMA 50 | $2.37 | SELL |
| SMA 100 | $2.49 | SELL |
| SMA 200 | $2.63 | SELL |
Daily exponential moving average (EMA)
| Period | Value | Action |
|---|---|---|
| EMA 3 | $2.21 | BUY |
| EMA 5 | $2.22 | SELL |
| EMA 10 | $2.23 | SELL |
| EMA 21 | $2.24 | SELL |
| EMA 50 | $2.34 | SELL |
| EMA 100 | $2.46 | SELL |
| EMA 200 | $2.78 | SELL |
What to expect from ICP price analysis
ICP is likely to consolidate with a bearish bias unless buyers reclaim $2.24. The $2.10-$2.15 area remains the key downside defense.
Is Internet Computer a good investment?
The Internet Computer (ICP) has shown significant potential and volatility since its launch, which is common for relatively new and ambitious blockchain projects. Its technology aims to decentralize the internet and bring smart contract functionality to the web, which could have wide-ranging implications for the future of web speed.
However, the market performance of ICP has been highly volatile, and its success depends heavily on the adoption of its technology and the broader market environment for cryptocurrencies. Please note that before you make an investment decision, seek independent professional consultation.
Will Internet Computer reach $50?
Yes, Internet Computer is expected to reach $50. Though the current internet computer sentiment is sideways, future price movements and market cap are expected to be positive.
Will ICP reach $1000?
Although its ATH sits at $750.73, attaining $1000 in the foreseeable future might be impossible. ICP is down 99% from its ATH and will require a massive turnaround in market fortunes to recapture previous highs. However, current price levels provide a good buying opportunity.
Where can I buy Internet Computer?
You can buy Internet Computer on the crypto market via Binance, Bybit, Coinbase Exchange, OKX, KuCoin, and more.
Does Internet Computer have a good long-term future?
Yes, the Internet Computer coin shows a promising long-term future. Price predictions indicate steady growth, with a potential increase year-on-year, reflecting a positive trend and strong market potential.
Recent news/opinion on ICP
- Internet Identity now has email recovery.
Internet Computer price prediction July 2026
In July 2026, ICP (Internet Computer) is expected to see a price range with a minimum of $2.00, an average of $2.35, and a maximum of $2.86.
| Month | Minimum price | Average price | Maximum price |
| ICP price prediction July 2026 | $2.00 | $2.35 | $2.86 |
Internet Computer price prediction 2026
For 2026, ICP’s price is projected to range between a minimum of $2.50 and a maximum of $5.89, with an average estimate of $4.03.
| Year | Minimum price | Average price | Maximum price |
| ICP price prediction 2026 | $2.05 | $3.81 | $4.57 |
Internet Computer price predictions 2027 – 2032
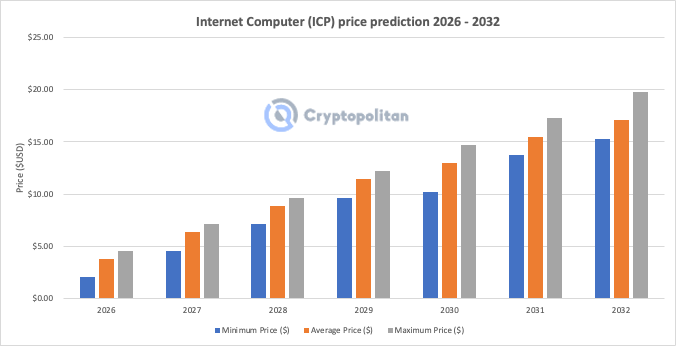
| Year | Minimum Price ($) | Average Price ($) | Maximum Price ($) |
| 2027 | $4.59 | $6.35 | $7.11 |
| 2028 | $7.13 | $8.89 | $9.66 |
| 2029 | $9.67 | $11.43 | $12.20 |
| 2030 | $10.21 | $12.98 | $14.74 |
| 2031 | $13.75 | $15.52 | $17.28 |
| 2032 | $15.30 | $17.06 | $19.82 |
Internet Computer price forecast 2027
Projections suggest that in 2027, the Internet Computer (ICP) coin could peak at $7.11, with a minimum forecast of $4.59 and an average price of around $6.35.
Internet Computer token price prediction 2028
In 2028, ICP could potentially reach a high of $9.66, with a projected low of around $7.13 and an average trading price of approximately $8.89.
Internet Computer ICP price prediction 2029
The 2029 forecast indicates that ICP could reach up to $12.20, with an average price of $11.43 and a minimum expected around $9.67.
Internet Computer ICP price prediction 2030
In 2030, ICP is expected to fluctuate between $10.21 and $14.74, with an average projected price of $12.98.
Internet Computer ICP price prediction 2031
Predictions suggest that the price of ICP could potentially reach a peak of $17.28 by 2031, with a projected minimum of around $13.75 and an average of approximately $15.52.
Internet Computer price prediction 2032
In 2032, analysts suggest a maximum price of $19.82 for ICP. Traders and investors can anticipate an average price of $17.06 and a minimum price of $15.30.
Internet Computer market price prediction: Analysts’ ICP price forecast
| Firm Name | 2026 | 2027 |
| Changelly | $2.51 | $2.24 |
| Priceprediction.net | $12.05 | $8.78 |
| Coincodex | $2.32 | $2.19 |
Cryptopolitan’s Internet Computer (ICP) price prediction
Cryptopolitan’s Internet Computer prediction showcases a gradual upward trajectory. In 2026, ICP is forecasted to range between $2 and $4, averaging around $2.5.
Subsequent years show increasing potential, with projections for 2027 aiming at a maximum of $6.81 and averaging $3.20. By 2032, Cryptopolitan anticipates ICP could peak at $15, with an average price of around $10.
Internet Computer historic price sentiment
- ICP began trading in 2021 at around $49.75, peaked near $128.43, and later fell sharply to around $37.61 before ending November near $38.18. By early 2022, it had weakened further, trading between $18.14 and $24.64.
- In 2022, ICP continued declining, falling from around $14.55 in March to $5.66 by August and ending November near $3.52.
- In 2023, ICP mostly traded between $2.88 and $6.49 before recovering strongly into early 2024, reaching $12.58 and closing February around $10.56.
- Through 2024, ICP remained volatile, ranging between $5.88 and $13.98 before closing December near $9.88 after a 20% pullback.
- In 2025, ICP peaked at $12.50 in January but weakened through the year, falling to an average of $5.03 in April and trading as low as $2.67-$3.75 by December.
- In 2026, ICP traded between $2.59 and $4.78 in January, $2.02 and $2.69 in February, and $2.17 and $2.84 in March. It averaged around $2.40 in April, while its May average price was approximately $2.50, based on CoinGecko historical data.
- In June 2026, ICP traded between approximately $2.02 and $2.59, recovering from its yearly low late in the month before closing June around $2.19. In July, the token has traded between roughly $2.15 and $2.39 so far, with ICP currently changing hands near $2.22.


Read More