Onyxcoin (XCN) has been one of April’s standout performers, soaring 132% month-to-date and nearly 10% in the past week. Trading volume has surged as well, climbing over 82% in the past day to reach $208.47 million, reflecting heightened interest and activity.
As the rally matures, key momentum and trend indicators start to shift. RSI has dipped, BBTrend has turned negative, and XCN is now testing a crucial support zone. With price action at a pivotal level, the next move could define whether this breakout continues or fades into a deeper pullback.
Onyxcoin RSI Dips—Is the Rally Losing Steam?
Onyxcoin is showing signs of cooling off after a sharp rally, with its Relative Strength Index (RSI) dropping to 63.21 from a peak of 75 just a day earlier, after its continued momentum that turned it into one of the best-performing altcoins of April.
The token saw an aggressive momentum shift over the past few sessions, with its RSI climbing from 36 on April 21 to 75 by April 23—reflecting a fast-paced surge in buying pressure.
While the move initially indicated overbought conditions, today’s dip to 63.21 suggests that momentum is easing, although it remains in bullish territory.
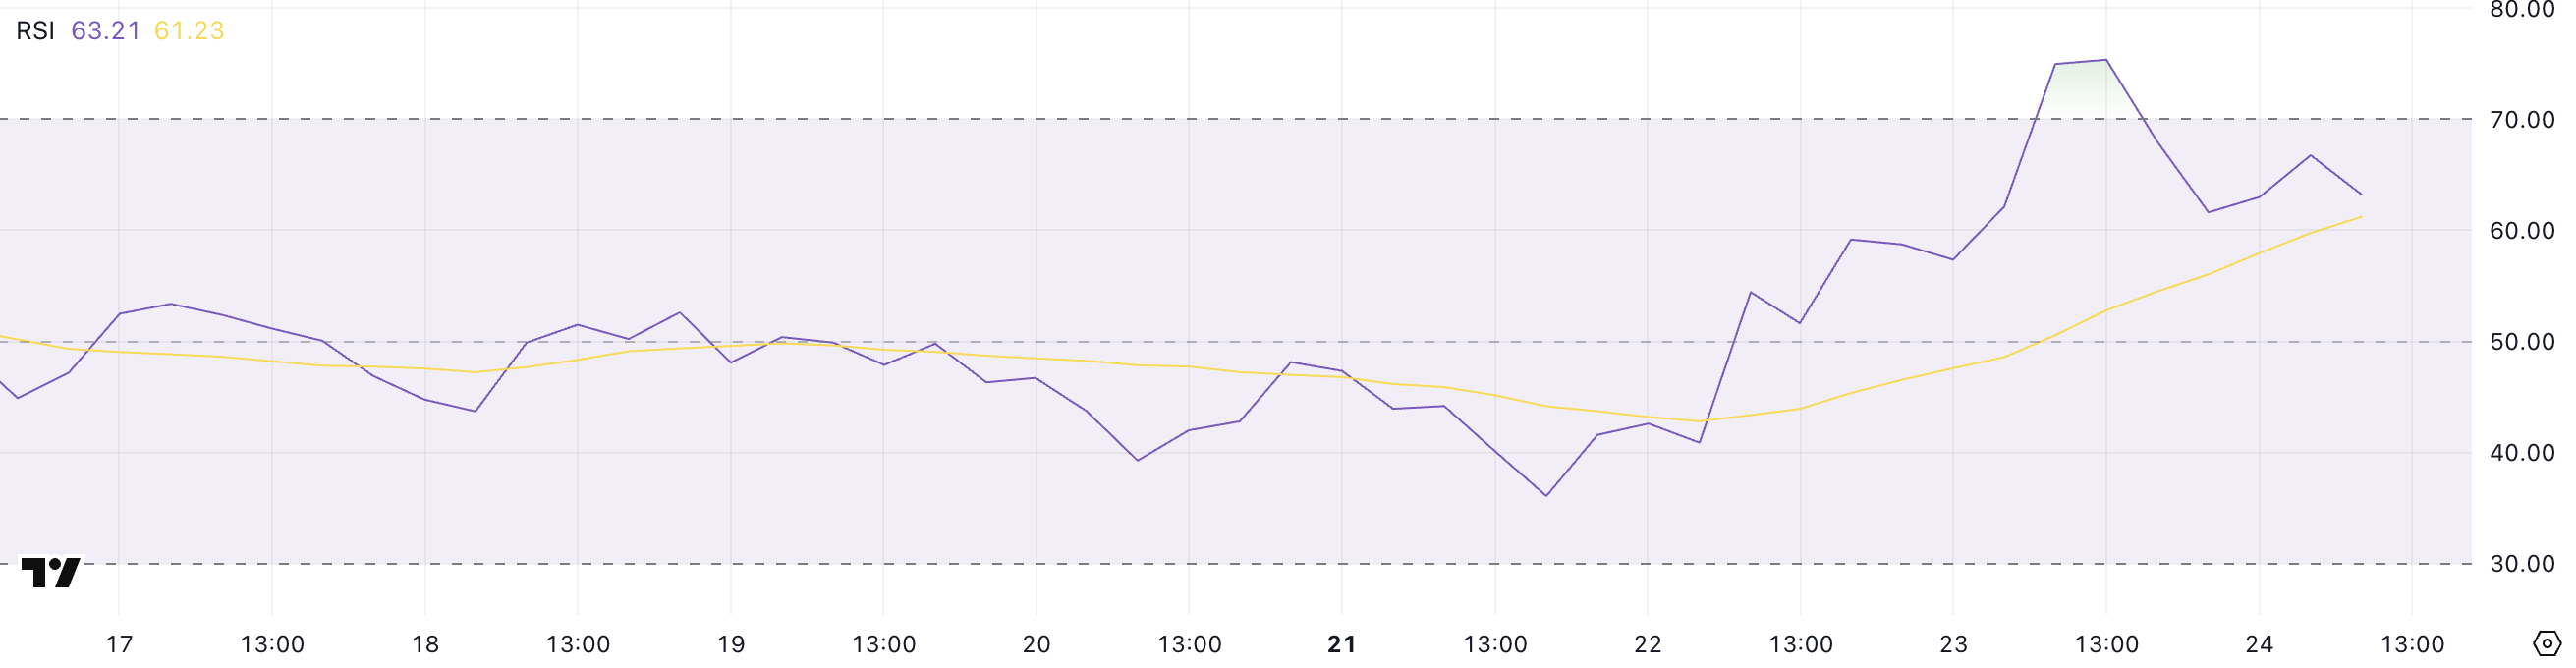
The RSI is a popular momentum oscillator that ranges from 0 to 100, often used to assess whether an asset is overbought or oversold.
Readings above 70 typically indicate overbought conditions, signaling that a pullback could be imminent, while levels below 30 suggest oversold territory and a potential buying opportunity. With XCN’s RSI now at 63.21, it implies the recent rally has lost some steam but still holds a bullish bias.
This could mean a brief consolidation or minor pullback is likely before any renewed push higher, especially if buyers step back above key support levels.
Onyxcoin BBTrend Turns Bearish Again—Trouble Ahead?
Onyxcoin BBTrend has sharply reversed, currently sitting at -5.53 after briefly touching a high of 3 yesterday. This marks a notable shift, considering the indicator had remained in negative territory between April 17 and April 23.
The sudden drop back into a strongly negative reading suggests the bullish momentum that fueled the recent rally may have been short-lived, and sellers could be regaining control in the short term.
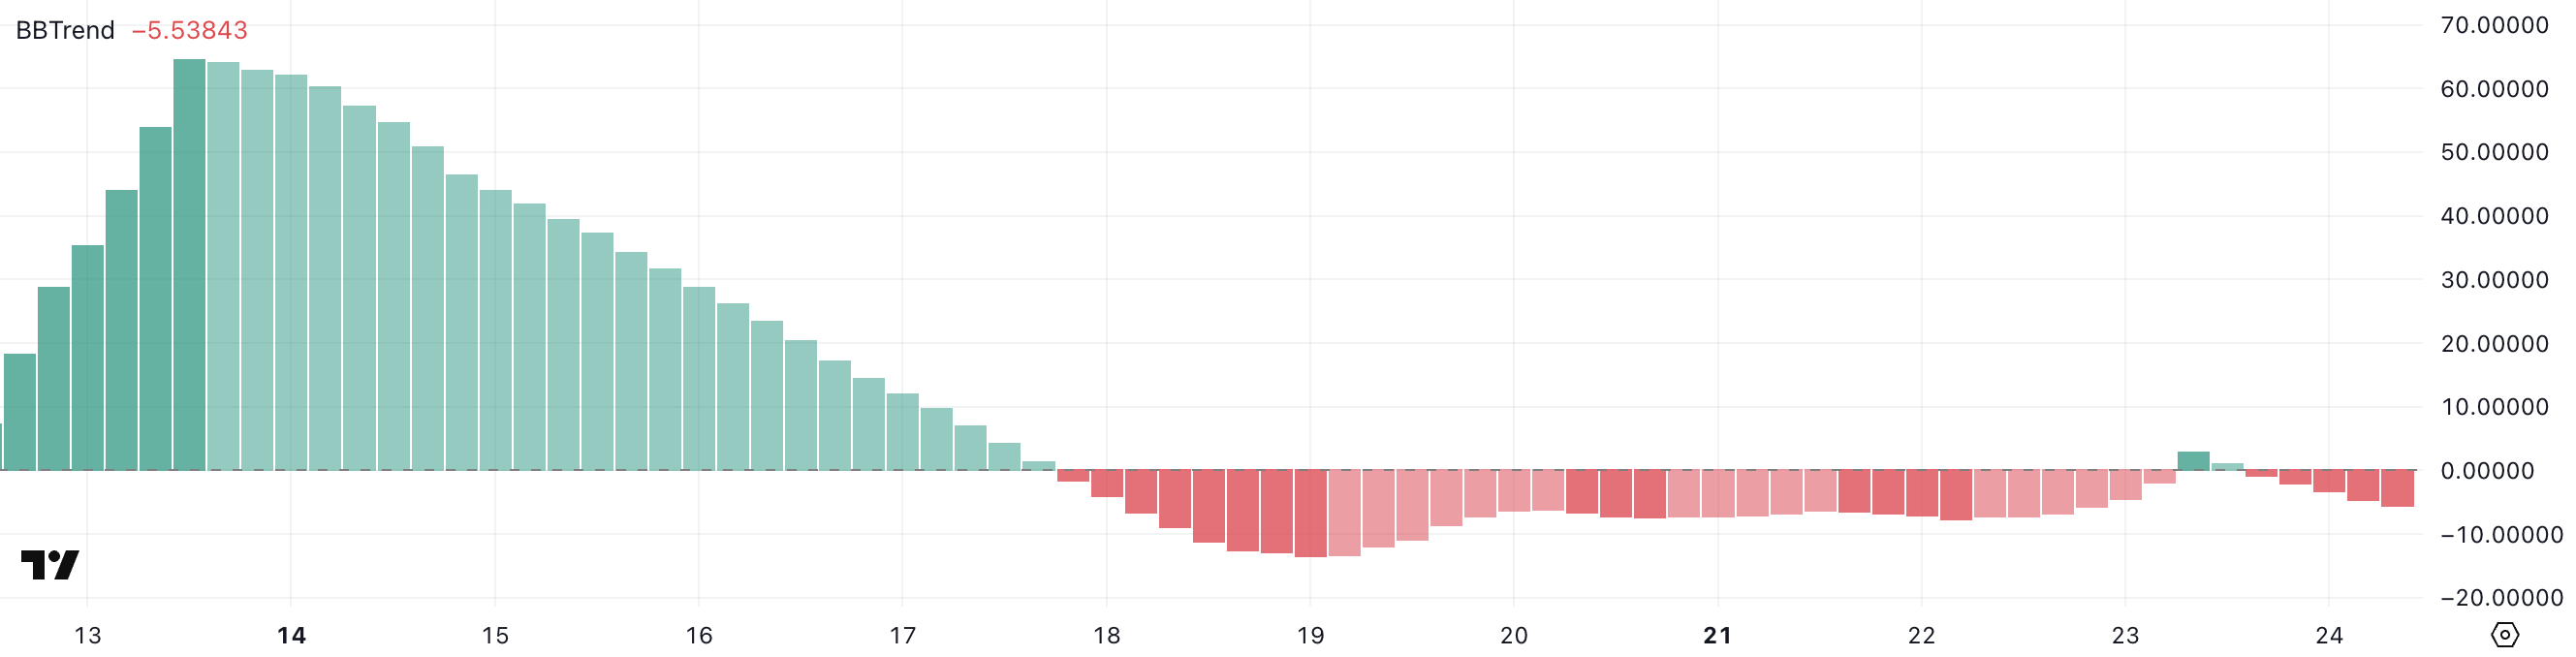
The BBTrend (Bollinger Band Trend) is a volatility-based momentum indicator that helps identify the strength and direction of price trends. Readings above +1 suggest a strong uptrend, while readings below -1 indicate a strong downtrend.
A move back to -5.53 signals that bearish pressure has returned and is intensifying.
This could mean that XCN’s recent price rebound may face increasing headwinds, with a possible return to support levels unless renewed buying interest reverses the trend again.
XCN Bulls Need to Hold the Line—Or Risk 35% Drop
Onyxcoin price is hovering just above a key support level of $0.020, a critical zone that could determine its next major move.
The EMA lines remain bullish, with short-term averages above long-term ones, suggesting the broader trend still leans upward.
If this support holds firm, XCN could rebound and target the resistance at $0.027. A break above that level could open the path toward $0.030—a price not seen since February 2.
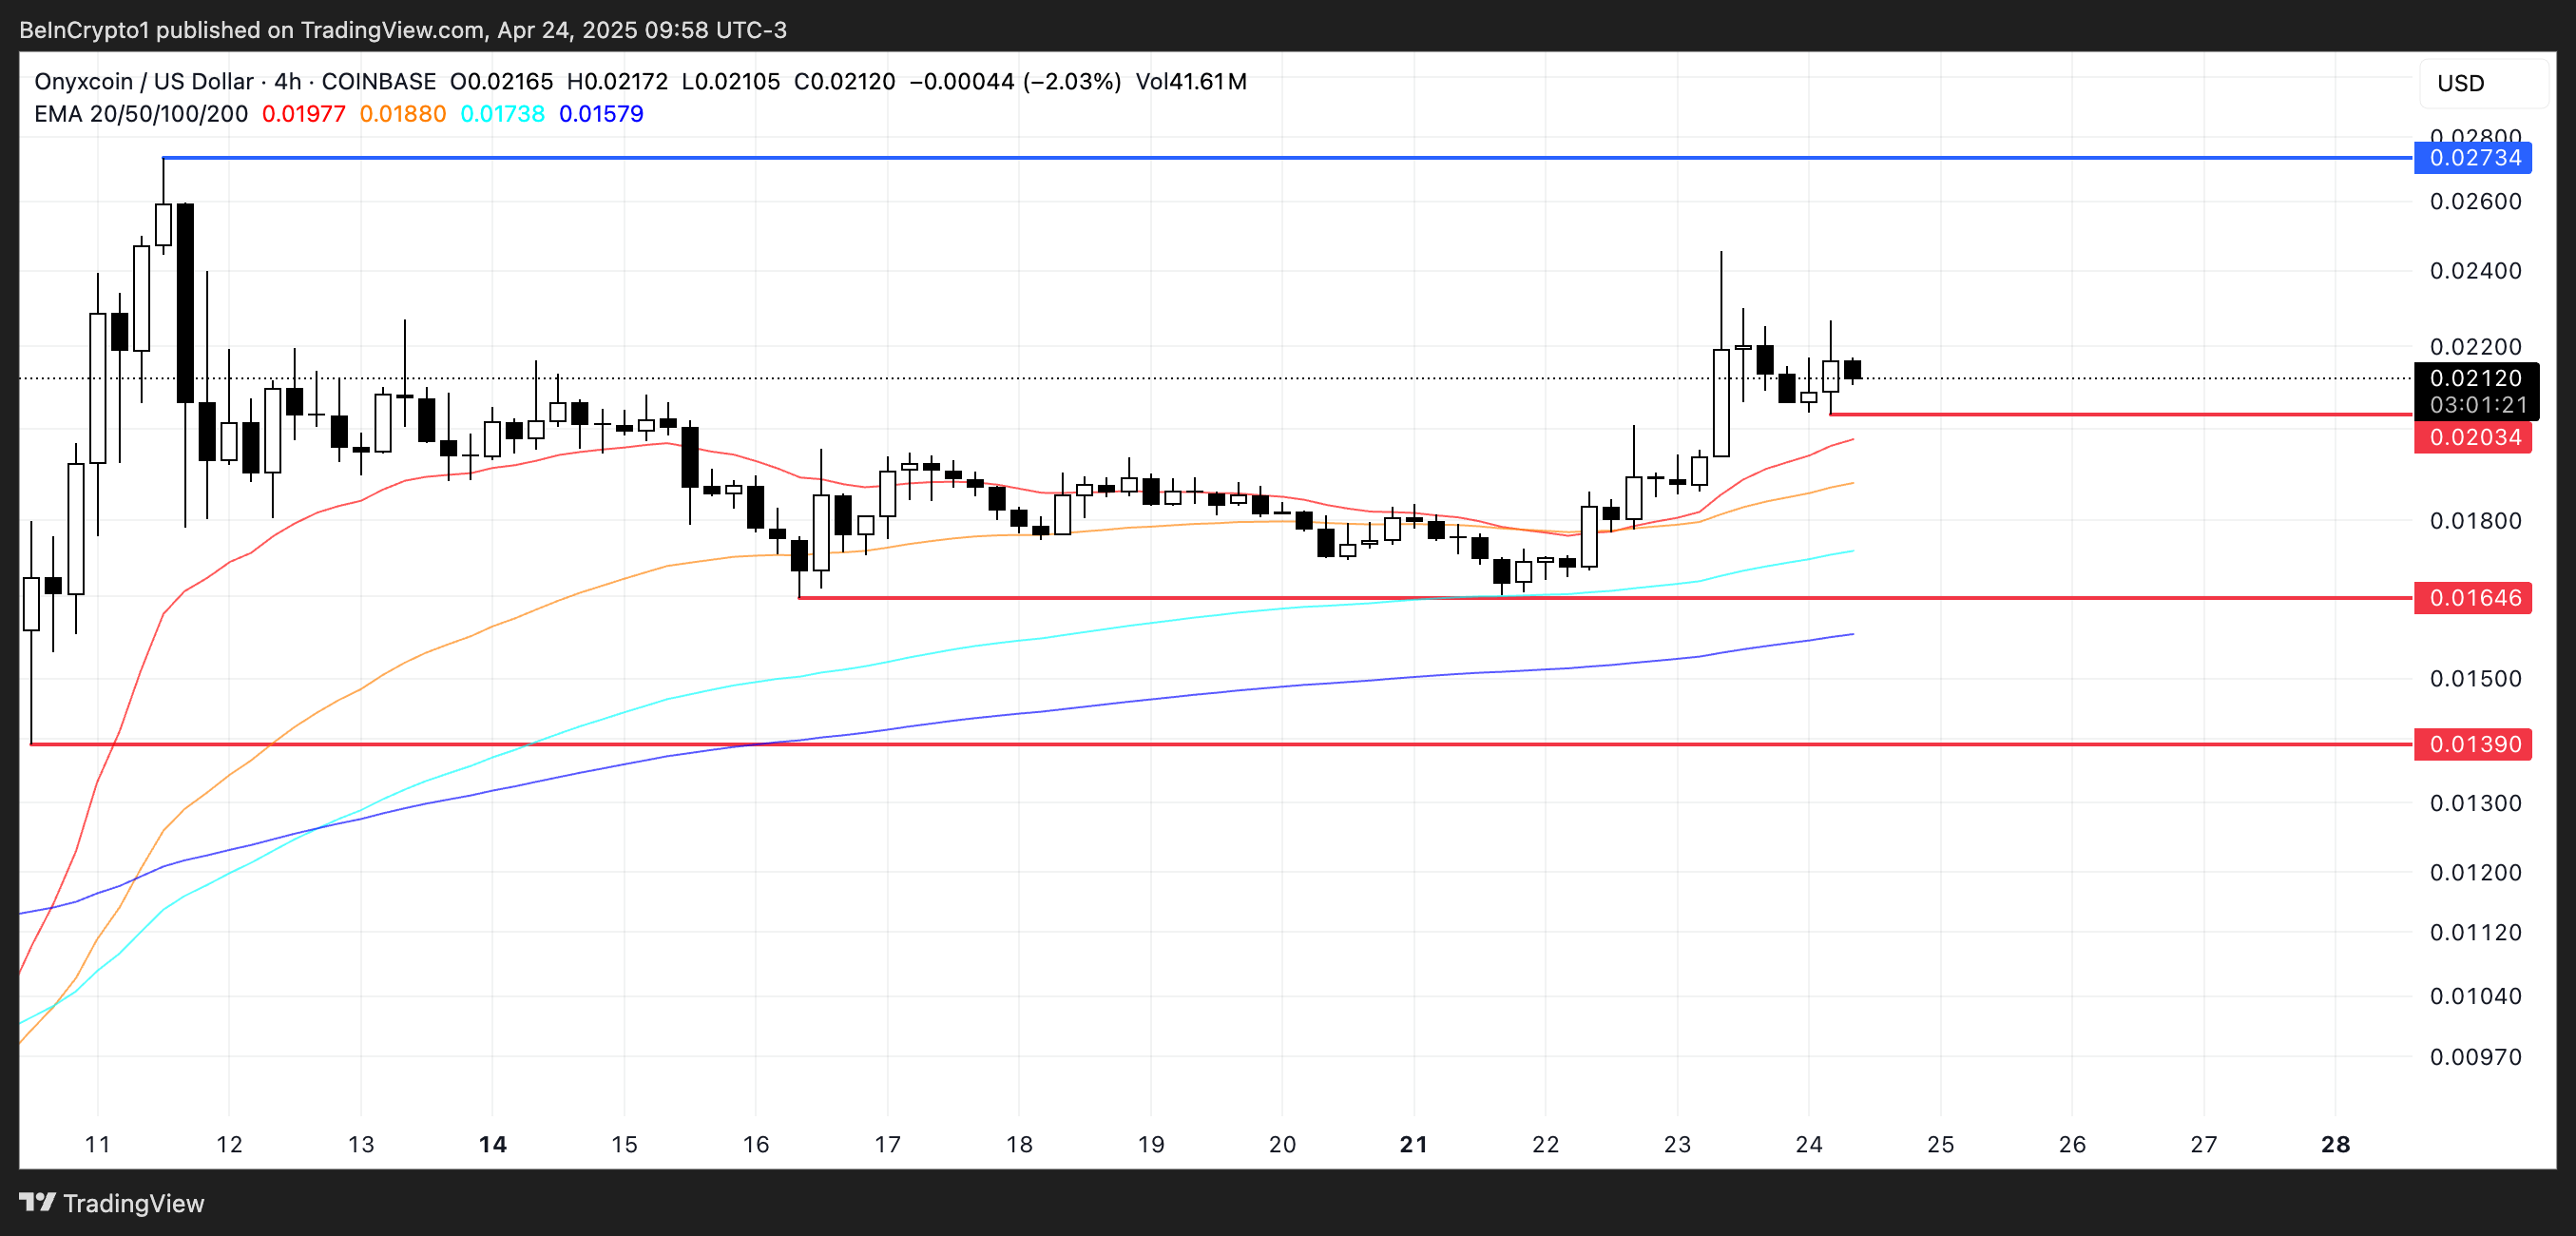
However, if the $0.020 support fails, the technical outlook could quickly shift bearish.
A drop below this level may push the price toward the next support at $0.016.
Should selling pressure intensify beyond that, XCN could decline to $0.0139, marking a possible 35% correction from current levels.
The post Onyxcoin (XCN) Faces Crucial Test After April’s Explosive Rally appeared first on BeInCrypto.


Read More