Key Takeaways:
- Our Ordinals price prediction anticipates a high of $11.10 in 2026.
- In 2028, it will range between $9.14 and $10.97, with an average price of $9.46.
- In 2030, it will range between $18.49 and $22.35, with an average price of $19.03.
In 2023, ORDI became the first BRC-20 token to breach $1 billion in market capitalization. Following this achievement, ORDI gained attention from DeFi enthusiasts for its role in innovation. The Ordinals protocol allows data to be embedded directly on Bitcoin’s smallest unit—the Satoshi.
ORDI was the first token inscribed on the Bitcoin Ordinals protocol; like Bitcoin, it has a maximum supply of 21,000,000 coins. Currently trading at the $8 mark, investors can’t help but speculate on Ordi’s price trajectory. How high will ORDI go? Can ORDI surge 100x? What will the price of ORDI be in 2030? Let’s explore the ORDI price prediction from 2026 to 2032.
Overview
| Cryptocurrency | Ordinals |
| Ticker | ORDI |
| Current price | $3.35 |
| Market cap | $70.62M |
| 24-hour trading volume | $18.92M |
| Circulating supply | 21M |
| All-time high | $96.17 on Mar 5, 2024 |
| All-time low | $1.41 on Oct 11, 2025 |
| 24-hour high | $3.57 |
| 24-hour low | $3.35 |
Ordi price prediction: Technical analysis
| Metric | Value |
| Volatility (30-day variation) | 11.57% (Very High) |
| 50-day SMA | $4.08 |
| 200-day SMA | $3.63 |
| Sentiment | Bearish |
| Green days | 18/30 (60%) |
| Fear and Greed Index | 22 (Extreme Fear) |
The 50-day and 200-day SMAs are commonly watched as moving averages to spot support and resistance levels, and these technical factors help frame price history alongside broader market signals.
ORDI price analysis
Ordinals (ORDI) fell by 4.01% on June 17, bringing its 30-day decline to 16.83%. Its trading volume fell by 6.26% over the last 24 hours, indicating market-wide loss of conviction in the trend. Recent price movements also point to shifting supply and demand, with whale activity able to sway a relatively small market that many traders watch closely under changing market conditions. ORDI’s future trend remains highly speculative and often follows Bitcoin’s broader macroeconomic moves, especially after fundamental events such as hacks and other real-world shocks.
ORDI/USD 1-day chart
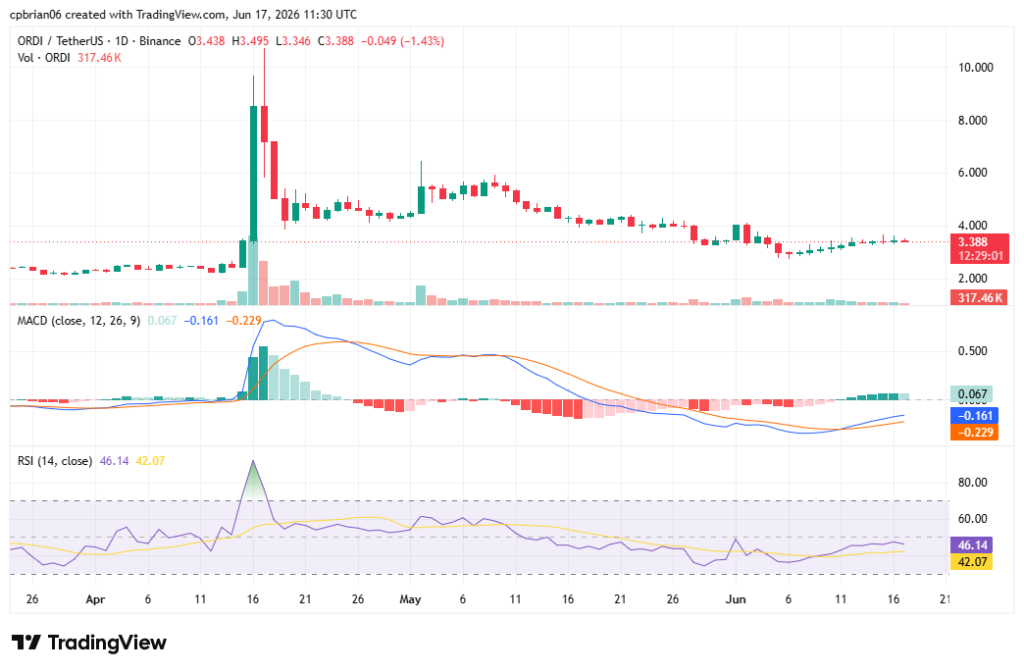
On candlestick charts, the daily chart helps traders track the closing price and the lowest price, while oscillators gauge trend strength and identify overbought or oversold conditions. ORDI rose fell more than 4% in a relatively volatile market. Over the short term, its sentiment mirrored Bitcoin, which was down 2% over the same period (24h).
ORDI/USD 4-hour chart
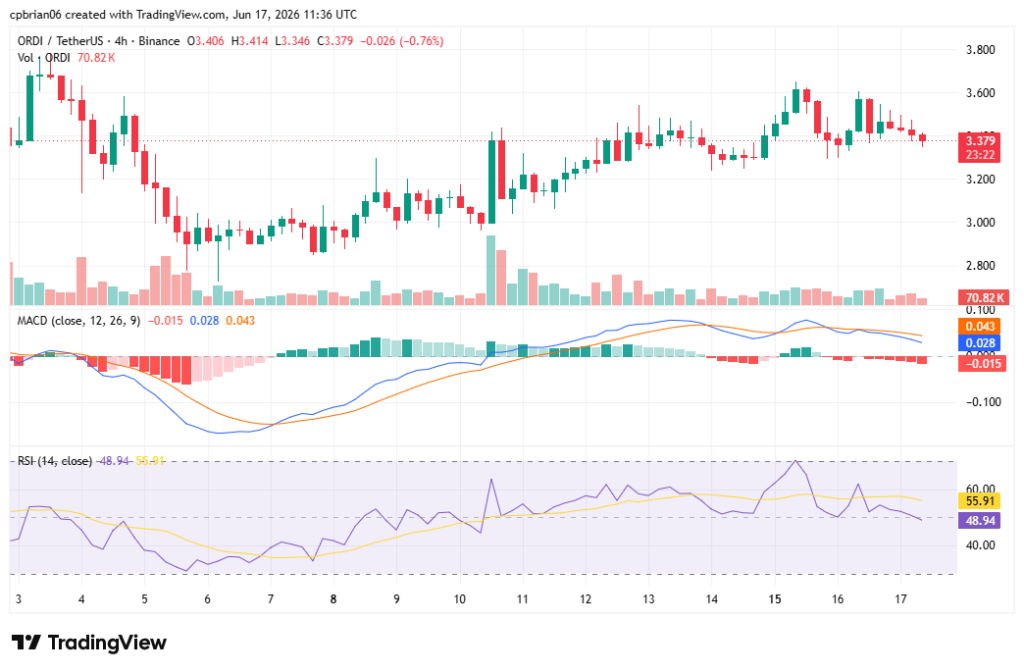
ORDI is bearish, registering lower highs and lower lows every 4 hours as recent price action continues to weaken. The run has forced ORDI into neutral territory (RSI 48.94), with the Relative Strength Index serving as a momentum oscillator in technical analysis: readings above 70 signal overbought conditions, and below 30 indicate oversold conditions.
ORDI technical indicators: Levels and action
Daily simple moving average (SMA)
| Period | Value ($) | Action |
| SMA 3 | 3.40 | SELL |
| SMA 5 | 3.38 | SELL |
| SMA 10 | 3.24 | BUY |
| SMA 21 | 3.34 | BUY |
| SMA 50 | 4.008 | SELL |
| SMA 100 | 3.59 | SELL |
| SMA 200 | 3.63 | SELL |
Daily exponential moving average (EMA)
| Period | Value ($) | Action |
| EMA 3 | 3.40 | SELL |
| EMA 5 | 3.36 | SELL |
| EMA 10 | 3.33 | BUY |
| EMA 21 | 3.44 | SELL |
| EMA 50 | 3.69 | SELL |
| EMA 100 | 3.73 | SELL |
| EMA 200 | 4.17 | SELL |
What to expect from the ORDI price analysis next?
ORDI’s drop is anchored in broader market sentiment rather than mere narrative hype. Continued selling pressure could cement lower floors, with sub‑$3 reversals looking increasingly likely as short-term price targets point to $3.10m levels tomorrow. Key price levels in the coming days suggest a range of $3.86 to $4.47 through next week, implying a potential correction.
Is ORDI a good investment?
ORDI had the first-mover advantage on the Ordinals protocol. Whether ORDI is a good investment decision depends on an investor’s risk tolerance and the wider market environment for digital assets, including global liquidity, inflation rates, and broad cryptocurrency regulation. Ordinals typically perform best during periods of bullish sentiment, when investors have excess Bitcoin to speculate with, but they also depend heavily on the Bitcoin network’s underlying infrastructure and highly volatile community trends. Our Cryptopolitan Price Prediction indicates the coin’s long-term outlook and how its value may increase in the years to come.
Recent news
Macro-driven market decline. Geopolitical risk from airstrikes on Gulf energy infrastructure sparked a flight from risk assets, pulling down Bitcoin and altcoins like ORDI. Still, Ordinals have grown from a niche experiment into a multi-billion-dollar economy, and expanding support for Bitcoin-native NFTs by major marketplaces is steadily improving market utility and broader adoption. At the same time, the rise of Bitcoin Layer-2 scaling solutions can shift base-layer Ordinal transaction volumes and liquidity, so traders should track on-chain activity and the latest trends.
Ordinals price prediction June 2026
The Ordinals forecast for June is a maximum price of $4.82 and a minimum price of $2.90. The average trading price will be $3.40.
| Month | Potential low ($) | Potential average ($) | Potential high ($) |
| June | 2.90 | 3.40 | 4.82 |
Ordinals price prediction 2026
For the remainder of 2026, ORDI’s price will range between $1.80 and $11.10. The average price for the year will be $5.10. Based on historical price data and broader price data models, some external forecasts are more conservative, with one projecting $2.81 by the end of 2026, $12.51 by 2030, and $20.18 by 2040.
| Year | Potential low ($) | Potential average ($) | Potential high ($) |
| 2026 | 1.80 | 5.10 | 11.10 |
Ordinals price prediction 2027 – 2031
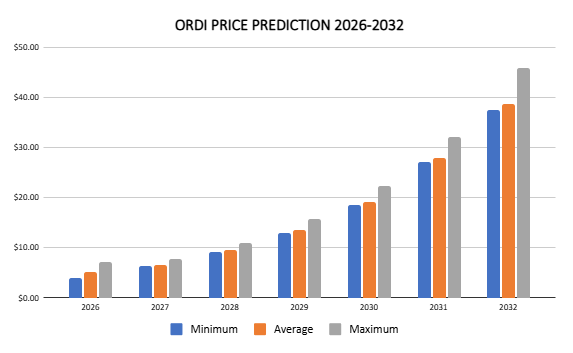
| Year | Potential low ($) | Potential average ($) | Potential high ($) |
| 2027 | 6.33 | 6.51 | 7.65 |
| 2028 | 9.14 | 9.46 | 10.97 |
| 2029 | 13.01 | 13.48 | 15.77 |
| 2030 | 18.49 | 19.03 | 22.35 |
| 2031 | 27.15 | 27.91 | 32.07 |
| 2032 | 37.51 | 38.63 | 45.84 |
Ordinals ORDI price prediction 2027
Ordinal coin price prediction continues to climb even higher into 2027. According to predictions, ORDI’s price will range from $6.33 to $7.65, with an average price of $6.51. Some alternative models suggest ordi could trade in a wider 2027 range, with a $2.70 low, a $5.76 average level, and a $9.36 high.
Ordinals crypto price prediction 2028
Our analysis indicates a further acceleration in ORDI’s price. It will trade between $9.14 and $10.97, averaging $9.46.
Ordinals ORDI price prediction 2029
According to the ORDI sats price prediction for 2029, ORDI’s price is expected to range between $13.01 and $15.77, with an average of $13.48. Some long-range models for 2030 also point to substantial potential ROI, with estimates around a $7.08 average price and a $14.39 high.
Ordinals price prediction 2030
According to the 2030 Ordinals price prediction, the price is expected to range between $18.49 and $22.35, with an average price of $19.03.
Ordinals price prediction 2031
The highest price for 2031 is $32.07. It will reach a minimum price of $27.15 and an average price of $27.91. Alternative projections for 2031 are lower, ranging from $7.17 to $11.74, with an average closing price of $8.37.
Ordinals price prediction 2032
The Ordinals ORDI price prediction ranges from $37.51 to $45.84, with an average price of $38.63.
Ordinals market price prediction: Analysts’ ORDI price forecast
| Platform | 2026 | 2027 | 2028 |
| Coincodex | $4.29 | $9.51 | $6.42 |
| Gate.com | $5.23 | $6.38 | $6.96 |
Cryptopolitan Ordinals price prediction
Our predictions indicate that ORDI will achieve a high of $11.10 in 2026. In 2028, it will range between $9.14 and $10.97, with an average of $9.46. In 2030, it will range between $18.49 and $22.35, with an average of $19.03. Note that the predictions are not investment advice. Seek independent consultation and do your own research before making any investment decision.
ORDI’s historic price sentiment
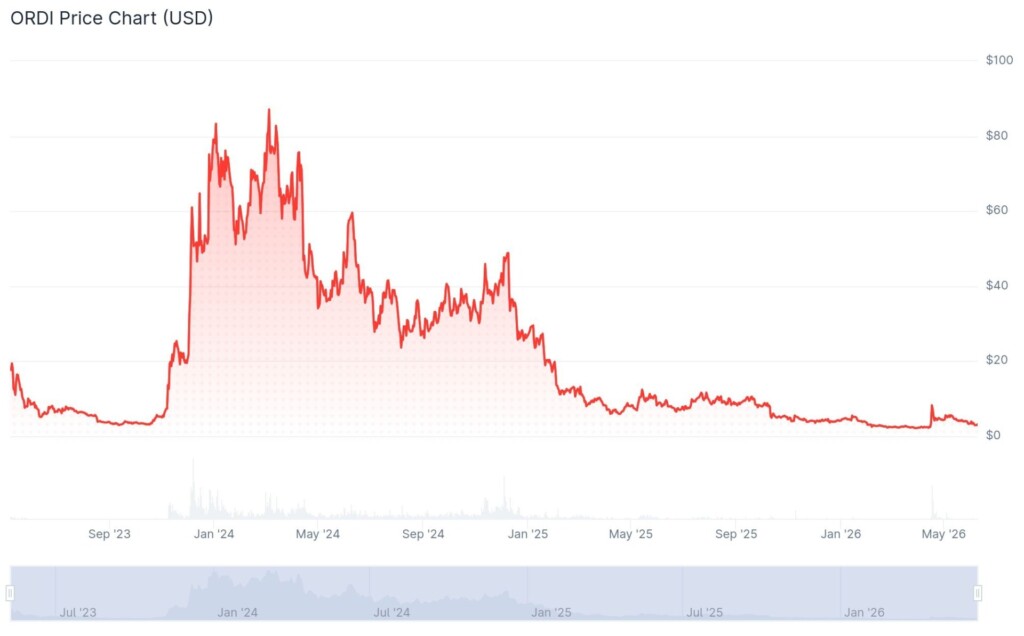
- According to CoinMarketCap, ORDI started trading in May 2023 at $25.3466. It later fell to its lowest level of $2.86 in September 2023.
- Binance listed ORDI on November 17, 2023. However, due to insufficient clarity from Binance, many mistakenly believed that ORDI was a direct product of the Ordinals protocol.
- This misunderstanding contributed to ORDI’s dramatic market performance. The meme coin saw a 40% increase in value within a single day, culminating in a 100% rise over four days.
- Despite these fluctuations, ORDI’s popularity surged, and by the end of 2023, its price had climbed above $50.
- ORDI peaked in March 2024 at $96.17, an all-time high.
- It later moved into a bear run, and by April, it had already dropped by 50%. It started recovering in November, rising above the $35 mark and $48 in December.
- In 2025, the trend quickly reversed, falling below $12 in February and $8 in May. In July, it was trading below $10. In October, it dropped $8 and assumed a bearish run; by December, it had reached $3.80.
- In 2026, it fell below $3.00. In March, it dropped below $2.50.
- ORDI quickly turned volatile. In April, it peaked at $9.20; weeks later, it dropped to $4.20. In May, it traded at $5.20. In June, it dropped to $3.20.


Read More