Key takeaways:
- Pendle’s price is projected to reach a maximum of $3.31 by the end of 2026.
- By 2029, Pendle’s price is expected to average $9.31.
- In 2032, the price of Pendle is predicted to reach a maximum of $8.35.
Pendle (PENDLE) is innovating in the DeFi space by enabling future yield trading. This unique approach helps users maximize returns through advanced smart contracts and seamless integration with other DeFi platforms.
Pendle’s recent progress, such as smart contract updates and strategic partnerships, marks its growth and commitment to innovation. Will these developments increase the value of $PENDLE? Is Pendle worth investing in?
Let’s dive into the Pendle price prediction for 2026-2032.
Overview
| Token | Pendle |
| Price | $1.34 |
| Market Cap | $229.44M |
| Trading Volume (24 hour) | $31.95M |
| Circulating Supply | 281.52M PENDLE |
| All-time High | $7.52 (Apr 11, 2024) |
| All-time Low | $0.03349 (Nov 10, 2022) |
| 24-hour High | $1.35 |
| 24-hour Low | $1.25 |
Pendle price prediction: Technical analysis
| Metric | Value |
| Price Prediction | $ 1.49 (2.12%) |
| Volatility | 6.80% (High) |
| 50-day SMA | $ 1.39 (SELL) |
| 14-Day RSI | 60.91 (Neutral) |
| Sentiment | Bearish |
| Fear & Greed Index | 28 ( Fear) |
| Green Days | 16/30 (53%) |
| 200-Day SMA | 1.50 (SELL) |
Pendle price analysis
TL;DR Breakdown:
- PENDLE is down 2.99% at $1.490, pulling back from the $1.574 intraday high as sellers defend the critical $1.50–$1.55 resistance zone after a strong 19.13% weekly gain triggered natural profit-taking.
- Both the 1D and 4H charts show price consolidating tightly around the recurring $1.40–$1.50 support zone, with the broader 2026 downtrend from January’s $2.50 peak still structurally intact despite the July recovery.
- A daily close above $1.55 would signal renewed bullish momentum toward $1.70, while losing $1.40 risks a swift return toward the $1.20 June lows.
PENDLE/USD 1-day chart
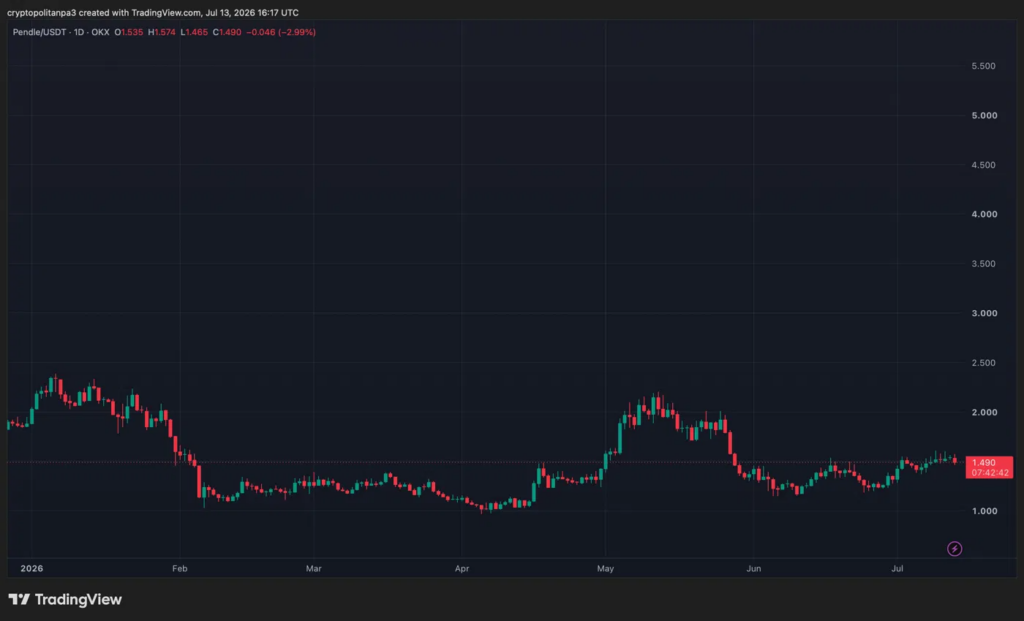
Pendle is trading at $1.490, down 2.99% on the day, pulling back after the July recovery attempt from June’s $1.20 lows stalled below the $1.574 intraday high. The 1D structure shows an extremely volatile 2026 — from January’s $2.50 peak through multiple cycles of boom and bust — with price now consolidating around the $1.40–$1.50 horizontal zone that has repeatedly acted as a critical support and resistance level throughout the year. Today’s red candle suggests the recovery momentum is fading. A daily close above $1.55 would signal renewed buying interest. Losing $1.40 risks a retest of the $1.20 June lows.
PENDLE/USD 4-hour chart
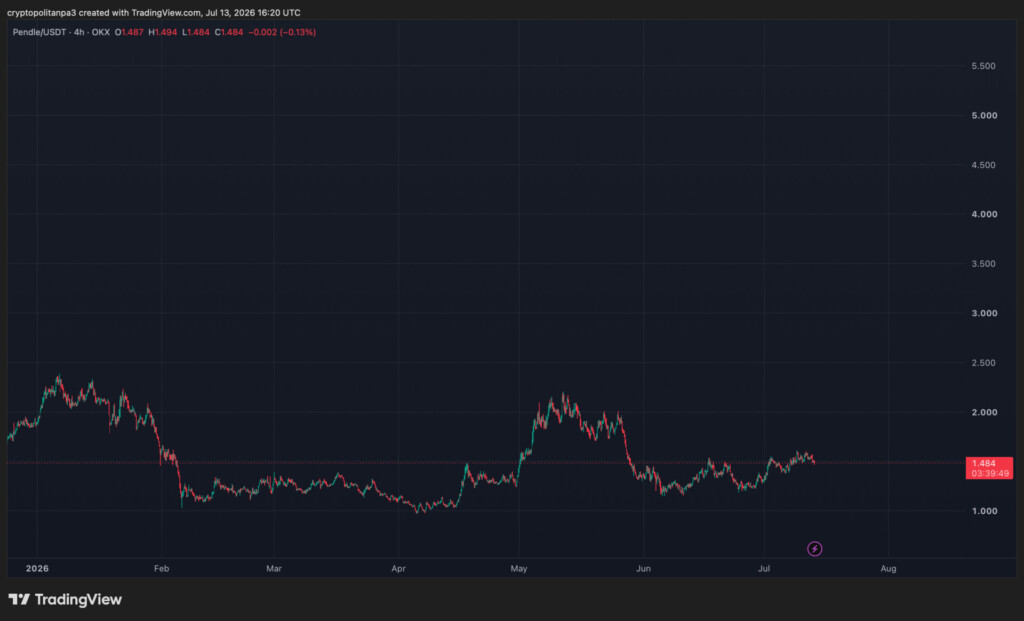
Pendle’s 4H chart shows price at $1.484, down a marginal 0.13%, consolidating around a key $1.40–$1.50 horizontal zone that has acted as a recurring floor and ceiling throughout 2026. The 4H structure reveals the full 2026 story — January’s $2.50 peak, a prolonged base, May’s sharp recovery to $2.20, and a devastating June collapse back toward $1.20 lows — with price now staging a tentative July recovery. Current 4H candles are tight and directionless, reflecting indecision at this critical level. A 4H close above $1.55 would signal short-term bullish continuation. Failure to hold $1.40 risks a swift pullback toward $1.20 June lows.
Pendle technical indicators: Levels and action
Daily simple moving average (SMA)
| Period | Value ($) | Action |
| SMA 3 | 1.53 | SELL |
| SMA 5 | 1.52 | SELL |
| SMA 10 | 1.49 | SELL |
| SMA 21 | 1.40 | BUY |
| SMA 50 | 1.39 | BUY |
| SMA 100 | 1.46 | BUY |
| SMA 200 | 1.50 | SELL |
Daily exponential moving average (EMA)
| Period | Value ($) | Action |
| EMA 3 | 1.53 | BUY |
| EMA 5 | 1.52 | SELL |
| EMA 10 | 1.48 | SELL |
| EMA 21 | 1.44 | BUY |
| EMA 50 | 1.46 | BUY |
| EMA 100 | 1.51 | SELL |
| EMA 200 | 1.82 | SELL |
What can you expect from PENDLE price analysis next?
Based on both charts, PENDLE is at a familiar crossroads. The $1.40–$1.50 zone has been the most contested level of 2026 — it’s held as a floor multiple times but also repeatedly capped recoveries.The most likely short-term scenario is continued consolidation between $1.40 and $1.55 as the market digests the July recovery gains. The Bungee Exchange V3 upgrade is a positive fundamental catalyst that could attract DeFi users, but it needs broader market support to translate into sustained price appreciation.If PENDLE can close decisively above $1.55 on a daily candle, the next targets are $1.70 and then $1.80–$2.00. That would represent a genuine trend shift after months of lower highs. However, if $1.40 breaks on a 4H close, the recovery from June’s lows fades quickly and $1.20 comes back into play. Watch the $1.40 level closely — it’s the line between recovery and relapse.
Why is Pendle down today?
PENDLE is down today due to a combination of profit-taking and broader market weakness. On the charts, sellers are defending the $1.50–$1.55 resistance zone aggressively after PENDLE posted a strong 19.13% weekly gain, making today’s pullback a natural consolidation response. The broader crypto market is also applying pressure, with Bitcoin declining and the Fear & Greed Index sitting at extreme fear levels, dragging DeFi tokens lower in tandem. Fundamentally, Pendle’s monthly revenue has dropped sharply from its 2025 highs, with yield compression across crypto markets significantly reducing PT and YT trading demand — keeping long-term sell pressure elevated despite the positive Bungee V3 integration announcement.
Is PENDLE a good investment?
Investing in Pendle coin offers a unique opportunity in the DeFi sector. Pendle’s approach to tokenizing and trading future yields allows for the flexible management of yield-bearing assets, enhancing investment portfolios. Conducting their research is crucial for potential investors to understand the Pendle market cap and the dynamics of its price movement.
Pendle’s ecosystem shows strong community trust, with impressive TVL, market cap growth, and endorsements from industry veterans like Arthur Hayes. These factors and high yields make Pendle a compelling investment in innovative DeFi projects.
Will Pendle reach $50?
The current Pendle price is around $1.28. Given its recent market trend, predictions suggest that by 2032, Pendle’s maximum price will not surpass the $50 mark.
Will Pendle reach $100?
Pendle price is likely to reach $100 in the foreseeable future.
Is Pendle a safe investment?
Pendle cryptocurrency offers innovative yield management features, making it appealing for investors. However, it carries risks like market volatility and potential technological issues. Investors should conduct thorough research and consider their risk tolerance before investing in Pendle.
Does Pendle have a good long-term future?
PENDLE has shown volatility and recent downward movement. Its short-term outlook appears uncertain. However, its long-term future could be positive if the project innovates, gains wider adoption, and maintains strong community and developer support.
Recent news/opinion on Pendle
Pendle has upgraded Bungee Exchange to V3, enabling any user holding any asset on any chain to access Pendle’s PT/YT fixed yield products in a single click with faster routing and lower fees.
Pendle price prediction July 2026
In 2026, the Pendle price is forecast to reach a low of $1.04. It could get a maximum of $1.61, with the average expected price around $1.36.
| Pendle price prediction | Potential Low | Average Price | Potential High |
|---|---|---|---|
| Pendle price prediction July 2026 | $1.04 | $1.36 | $ 1.61 |
Pendle price prediction 2026
Pendle’s 2026 forecast of $3.24–$4.67, with an average closing price of $3.95, is driven by its growing role in yield tokenization, allowing users to trade future yield streams. Rising DeFi adoption, strong TVL growth, and integrations with major Ethereum Layer-2s strengthen demand. Market-wide consolidation, however, limits extreme volatility, keeping Pendle within this range.
| Pendle Price Prediction | Potential Low | Average Price | Potential High |
|---|---|---|---|
| Pendle Price Prediction 2026 | $3.24 | $3.95 | $4.67 |
Pendle price prediction 2027-2032
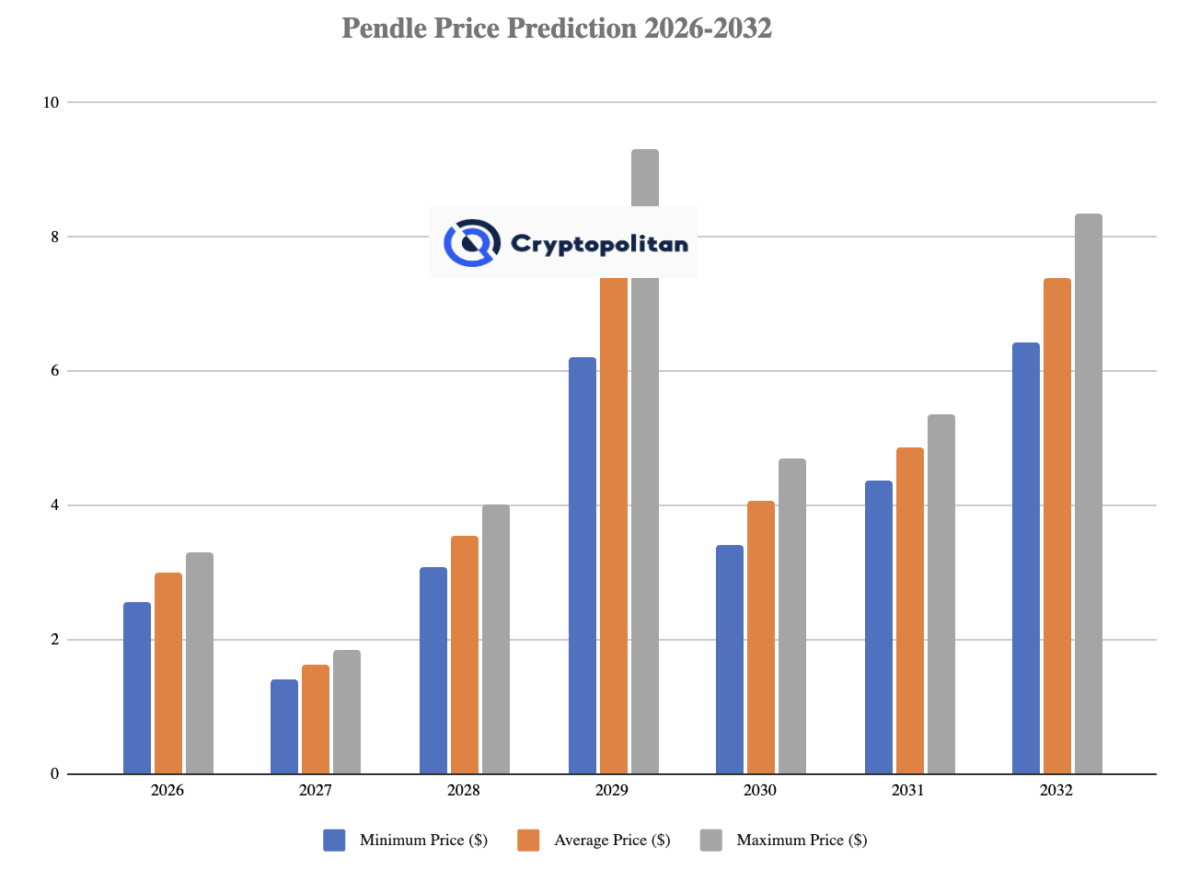
| Year | Minimum price | Average price | Maximum price |
|---|---|---|---|
| 2027 | $1.40 | $1.62 | $1.85 |
| 2028 | $3.09 | $3.55 | $4.01 |
| 2029 | $6.21 | $7.76 | $9.31 |
| 2030 | $3.41 | $4.06 | $4.71 |
| 2031 | $4.37 | $4.86 | $5.35 |
| 2032 | $6.43 | $7.39 | $8.35 |
Pendle Price Prediction 2027
In 2027, the price of Pendle is predicted to reach a minimum level of $1.40. It can also reach a maximum level of $1.85 and an average trading price target of $1.62. This is expected due to an expanding adoption of yield tokenization as institutional players and DeFi protocols increasingly integrate fixed-yield products. Higher TVL, cross-chain growth, and broader Ethereum scaling solutions are expected to boost utility. At the same time, market corrections may cap extreme gains, keeping prices within range.
Pendle price prediction 2028
Pendle’s 2028 forecast of $3.09–$4.01, averaging $3.55, is fueled by growing TVL, stronger cross-chain integrations, and institutional interest in fixed-yield products. Demand should rise steadily.
Pendle price prediction 2029
The PENDLE price prediction for 2029 projects a minimum price of $6.21 for the token. According to the analyst forecast, the token could reach a maximum price of $9.31 and an average trading price of $7.76.
Pendle price prediction 2030
The price of Pendle is predicted to decline from previous years and reach a minimum value of $3.41 in 2030. Per the predictions, holders can expect a maximum price of $4.71 and an average trading price of $4.06.
Pendle price prediction 2031
The Pendle price forecast for 2031 projects has a minimum price of $4.37, a maximum price of $5.35, and an average forecast price of $4.86.
Pendle price prediction 2032
Pendle’s price is expected to reach a maximum price of $8.35, with a minimum price of $6.43 by 2032. The average trading price is expected to be $7.39.
Pendle market price prediction: Analysts’ $PENDLE price forecast
| Firm | 2026 | 2027 |
|---|---|---|
| DigitalCoinPrice | $1.56 | $2.34 |
| Coincodex | $ 1.31 | $2.58 |
Cryptopolitan’s PENDLE price prediction
In 2026, Cryptopolitan projects that $PENDLE could experience notable price fluctuations, with a potential low of $1.50, and a possible high of $2.00.
Pendle historic price sentiment
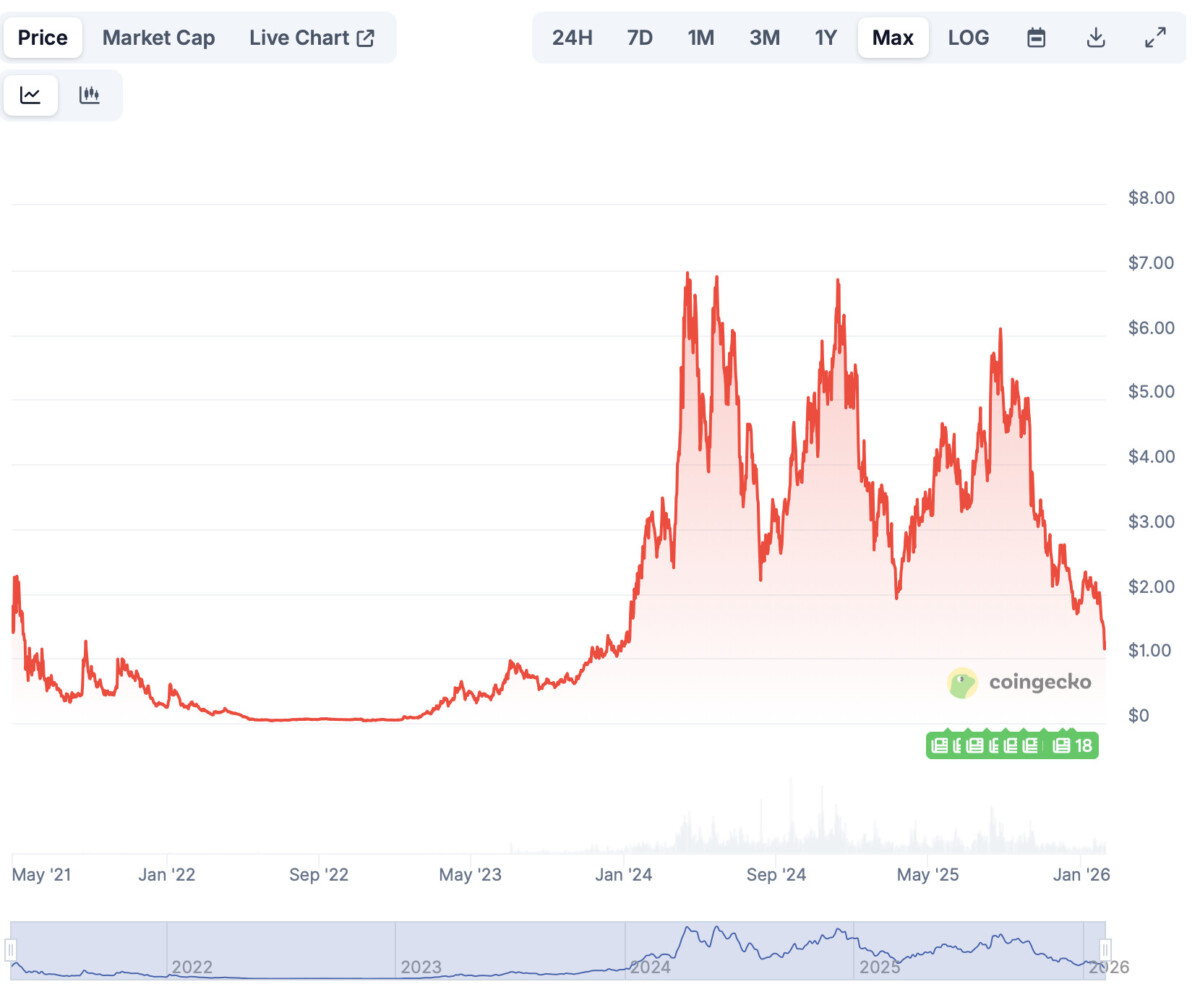
- Pendle traded below $1 from its 2020 launch until late 2023, when it rose to around $1.20
- In 2024, the token rallied strongly to $7.52 in April before correcting and closing the year at $5.07
- Early 2025 saw a sharp decline below $2 amid US-China tensions before recovering above $3 by April
- Between July and August 2025, Pendle fluctuated between $3.74 and $6.00, showing both volatility and resilience
- Since early September, Pendle has stabilized between $4.70 and $5.30 with steady demand driven by DeFi and yield tokenization growth
- In early November, the price ranged around $2.70–$3.05, dipping mid-month toward the $2.10–$2.30 range as the token retraced.
- By late November to early December, Pendle recovered modestly, climbing back into the $2.60–$2.75 zone — around $2.64 on Dec 3 — suggesting the token stabilized after mid-month weakness.
- From December 2, 2025, Pendle moved down from around $2.64 to the low $1.70s by mid-December, reflecting a steady decline as the price slipped through support levels and volatility increased.
- Into late December and early January, Pendle rebounded from roughly $1.71 to the high $1.80s by Dec 31, then continued higher into 2026, closing near $2.19 on Jan 2 and ~ $2.17 on Jan 3 as momentum improved.
- From January 3 to mid-January 2026, Pendle climbed from the low-$4 range into the mid-$5 area, driven by strong momentum after a breakout above short-term resistance and rising trading volume.
- From late January through February 7, 2026, price action cooled as Pendle pulled back toward the high-$4 to low-$5 zone, with sellers defending overhead levels while buyers stepped in repeatedly near support to prevent a deeper decline.
- From February 7 to mid-March 2026, BRETT grinded steadily lower from around $0.0080–0.0085 — breaking through multiple support levels with brief relief bounces failing to hold — eventually hitting a low near $0.0062 by late March as broad crypto selling and “Extreme Fear” sentiment crushed memecoin demand.
- From late March into April 6, BRETT attempted a fragile stabilization between $0.0062–0.0070, trading in an increasingly compressed range with microscopic candles — closing April 6 at $0.00635, representing a total decline of roughly 25% over the period with no meaningful recovery catalyst emerging.
- PENDLE entered April 7 trading around $1.42 to $1.56, sitting near multi-month lows after a prolonged downtrend from its all-time high of $7.50, with long-term weakness confirmed by a falling 200-day moving average.
- By May 8, PENDLE surged to $2.04, up 9.90% in 24 hours and 36.50% over the past seven days, fueled by Apollo and Paxos routing yield through the platform and trading volume exceeding $80 million.
- PENDLE entered May 8 trading around $2.08, having surged over 100% from April lows near $1.00 driven by Apollo and Paxos routing yield through the platform and Morpho PT markets hitting $50.5M TVL, before the rally quickly reversed with price declining sharply throughout May as profit-taking and an 87.6% collapse in protocol revenue drained buying conviction.
- By June 8, PENDLE had fallen to around $1.29, down significantly from the May highs, having erased most of the recovery gains as ETH’s catastrophic breakdown below $1,700 and broad DeFi market weakness dragged the token lower, with the market cap collapsing to approximately $202 million and PENDLE now trading 84.20% below its all-time high of $7.50. PENDLE opened June 6, 2026 near $1.40, then suffered a sharp decline through the month as broader DeFi weakness, ETH underperformance, and extreme fear sentiment pushed price to a 2026 low near $1.20 by late June — erasing the May recovery from $2.20 highs and triggering a 19.69% monthly loss.
- By July 13, PENDLE has recovered to approximately $1.48–$1.85, bouncing from the $1.20 June lows with a 19.13% weekly gain as the protocol replaced its vePENDLE lockup system with the more flexible sPENDLE liquid staking token and community sentiment improved alongside the broader crypto market recovery heading into mid-July.


Read More