Key Takeaways:
- Pi price faces volatility below the $0.17 level.
- Our Pi network price prediction anticipates the Pi price to reach a maximum level of $0.2484 by 2026.
- In 2032, the Pi price prediction expects Pi to reach a maximum level of $2.32.
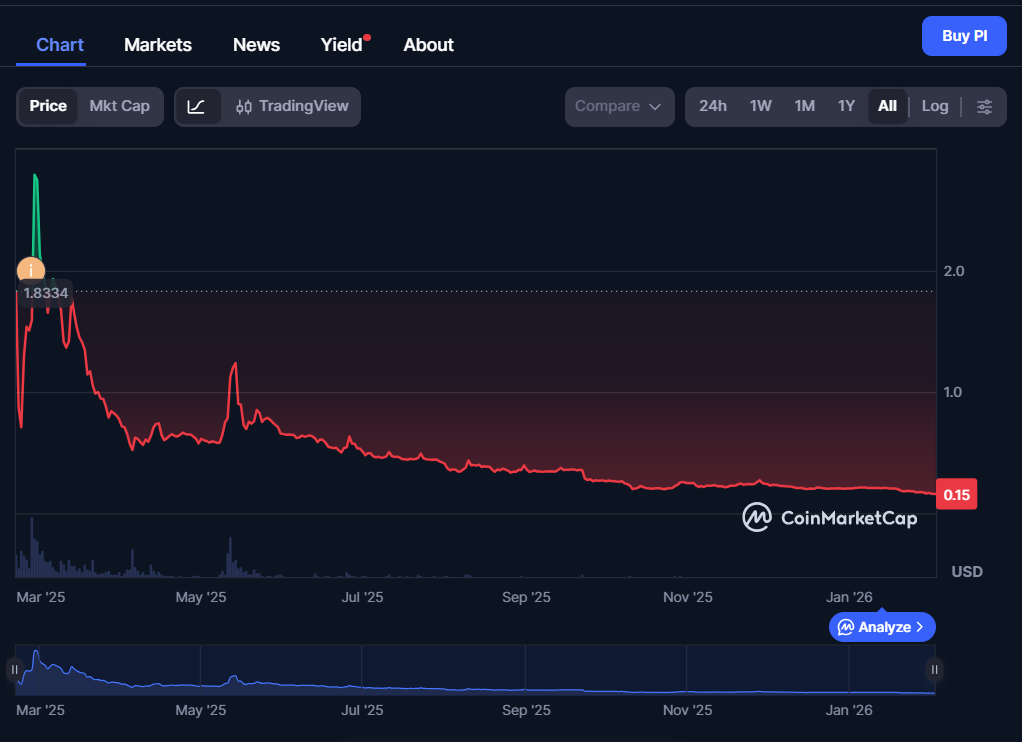
Pi Network is a social crypto and developer ecosystem focused on mass accessibility and real-world use, founded by Stanford PhDs Dr. Nicolas Kokkalis and Dr. Chengdiao Fan. As 2026 unfolds, Pi continues to operate as a live Layer-1 blockchain with open transfers, exchange liquidity, and a growing app ecosystem. After reaching an all-time high of $2.98 on Feb. 26, 2025, Pi has extended its decline, recording a new all-time low of $0.1312 Feb 11, 2026, as weak demand kept price action pressured.
Despite the volatility, the ecosystem has continued to evolve. Pi Network has expanded mainnet migration access for approximately 2.5 million previously restricted users, raising total eligible participants to around 16 million, while pushing developer upgrades such as the Protocol v23 release, a new payments library that enables app integration in under 10 minutes, and a Jan. 22–23 Pi App Studio update that adds no-code PI payment tools on Test-Pi as groundwork for future Mainnet monetization.
In this Pi Network price prediction, we discuss these developments, major technical levels, and the model of an exponential supply of Pi in decline to determine whether 2026–2032 favors a sustained recovery or further downside.
Overview
| Cryptocurrency | Pi Network |
| Ticker Symbol | Pi |
| Price | $0.1702 |
| Price Change 24h | _0.95% |
| Market Cap | $1.58B |
| Circulating Supply | 9.01B PI |
| Trading Volume 24h | $13.92M |
| All-Time High | $2.98, Feb 26, 2025 |
| All-Time Low | Feb 11, 2026 $0.1312 |
Pi Network Price Prediction: Technical Analysis
| Metric | Value |
| Current Price | $0.1702 |
| Price Prediction | $ 0.1160 (-25.12%) |
| Fear & Greed Index | 14 (Extreme Fear) |
| Sentiment | Bearish |
| Volatility | 9.15% (High) |
| Green Days | 12/30 (40%) |
| 50-Day SMA | $0.1988 |
| 200-Day SMA | $0.2925 |
| 14-Day RSI | 30.69 (Neutral) |
Pi Price Analysis
TL;DR Breakdown:
- Pi price analysis shows that Pi is facing buying pressure toward the $0.17 level after successfully holding above immediate support.
- The current immediate Pi resistance is at $0.1733.
- Pi support is forming near $0.167.
As of February 26, 2026, Pi is trading at $0.1702, up 0.95% on the day. Pi’s price has moved slightly within the $0.169 to $0.171 range, showing stability in the short term. The market is currently dominated by buyers with a market cap of $1.58B and 24h volume of $13.92M, reflecting a 11.86% decrease from the previous day. This shows a reduction in trading activity.
Pi price analysis 1-day chart: Pi consolidates near $0.170
On the daily time frame, Pi price analysis shows that Pi is facing buying pressure toward the $0.17 level after successfully holding above immediate support at $0.167. The price went to a high of $0.170, and currently, Pi is trading at $0.1702.
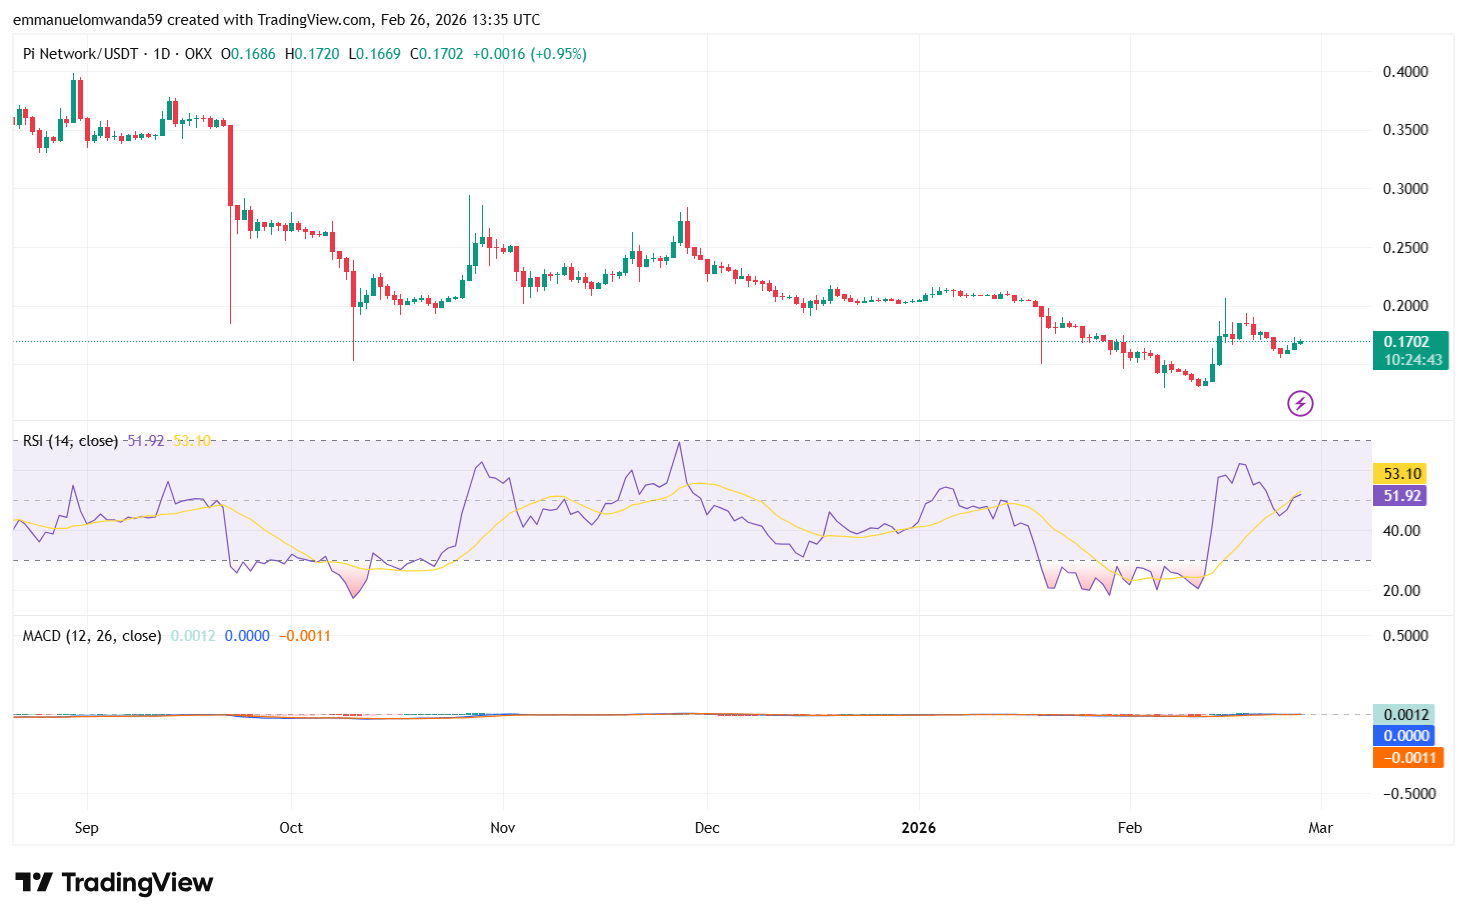
The RSI is at 53.10, which is in the neutral zone, above 50, showing that the market is balanced, with no clear bullish or bearish dominance. However, buying pressure is slightly stronger, as the RSI is above the 50 mark.
The MACD line is at 0.0012, while the signal line is 0.0000, with the histogram at -0.0011, showing a lack of momentum. The market could be cooling off, and if momentum shifts, we might see a continuation of the recent consolidation pattern.
Immediate support stands at $0.167, while resistance remains at $0.1733. A break below support could extend losses, while reclaiming $0.1702 would be needed to shift short-term sentiment.
Pi/USD 4-Hour Price Analysis
On the 4-hour timeframe, Pi is experiencing short-term weakness again after it was unable to maintain higher levels. The price is trading at $0.1691 after opening at $0.1689, reaching a high of $0.1709, and dropping to a low of $0.1688 on the 4-hour chart.
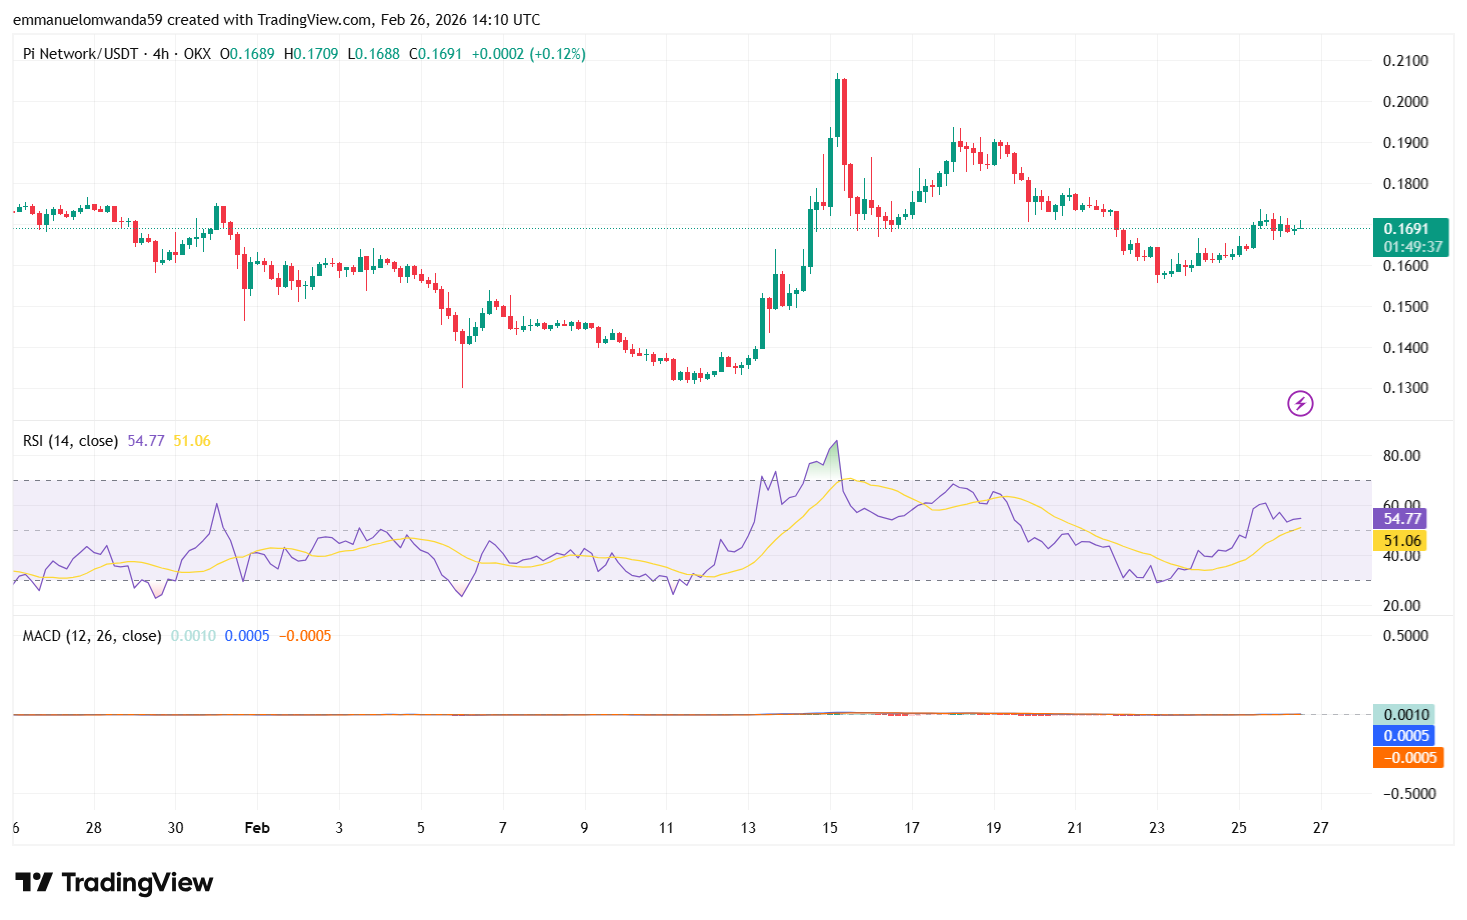
Momentum is weakening. The RSI (14) stands at 54.77, and its moving average is 51.06, meaning that Pi is in a neutral position but has no powerful momentum. The market is neither oversold nor overbought.
The MACD (12, 26) shows the MACD line at 0.0010, the signal line at 0.0005, and the histogram at -0.0005, suggesting that while momentum is slightly bullish, it remains weak, and further price action may be needed to confirm a stronger trend.
Immediate support is forming near $0.1669, while short-term resistance stands at $0.1709. A break below support could extend losses further, while reclaiming $0.1709 would be needed to stabilize intraday sentiment.
Pi Network Price Prediction: Levels and Action
Daily Simple Moving Average (SMA)
| Period | Value | Action |
| SMA 3 | $0.1800 | SELL |
| SMA 5 | $0.1732 | SELL |
| SMA 10 | $0.1729 | SELL |
| SMA 21 | $0.1855 | SELL |
| SMA 50 | $0.1988 | SELL |
| SMA 100 | $0.2157 | SELL |
| SMA 200 | $0.2925 | SELL |
Daily Exponential Moving Average (EMA)
| Period | Value | Action |
| EMA 3 | $0.1872 | SELL |
| EMA 5 | $0.1941 | SELL |
| EMA 10 | $0.2002 | SELL |
| EMA 21 | $0.2045 | SELL |
| EMA 50 | $0.2140 | SELL |
| EMA 100 | $0.2432 | SELL |
| EMA 200 | $0.3316 | SELL |
What to expect from the Pi price analysis next?
In the next price analysis we can expect continued consolidation near the $0.169 level, with $0.1709 acting as short-term resistance. If the price breaks below $0.1669, it could trigger further declines, while reclaiming $0.1709 may signal a potential upward move.
Why is PI’s price up today?
Pi’s price is up today, mainly driven by hype surrounding the March 1, 2026, protocol upgrade for Pi’s Mainnet, which traders see as a positive catalyst. Additionally, the broader crypto market rebound has contributed to a 5% intraday gain, with Pi tracking the movement of major cryptocurrencies like Bitcoin. However, heavy token unlocks scheduled for early March may create selling pressure, adding risk to the short-term rally.
Is Pi a Good Investment?
Currently, Pi Network is facing consolidation within its price range, with further downside likely unless it can break above $0.1733 and hold steady with increasing volume. If the price continues to follow the broader crypto market, traders should be cautious of potential tests of lower support levels near $0.1625. Until Pi shows stronger momentum or breaks key resistance levels, it may face continued volatility and uncertainty.
Will Pi Price Reach $5?
At the current pace of development and given its total PI supply circulating supply of over 8 billion PI, Pi Network’s value is unlikely to reach $5 in the near term. Multiple technical quantitative indicators and fundamental factors, such as delayed mainnet launch and maximum supply constraints, suggest that Pi’s price may fluctuate within lower ranges before any major uptrend. A $5 target would require sustained adoption, significant on-chain activity, and strong market demand that is not yet present.
Will Pi Reach $10?
Reaching $10 would represent a massive increase in Pi’s market cap, something that is not expected soon under current crypto market conditions. Analysts suggest that even optimistic forecasts place this milestone more than a decade away, if at all. Investors should treat such projections as speculative investment advice and conduct their own research before making investment decisions, as Pi remains a high-risk asset with uncertain long-term value.
Recent Pi News/Opinions
Pi Network said it has expanded KYC and Mainnet migration access by unblocking millions of previously restricted Pioneers and preparing to open KYC submissions for more than 700,000 additional users, as it continues batch processing for security and compliance.
Pi Network is currently undergoing a series of upgrades to its Mainnet blockchain protocol, with the first upgrade step due by February 15, 2026. All Mainnet nodes must complete this upgrade to remain connected to the network, ensuring continued participation in the Pi ecosystem.
Pi Network has recently completed its Protocol v19.6 migration and announced that v19.9 will be the final upgrade before the launch of v20, marking another milestone toward deeper decentralization. The team urged node operators to upgrade to the latest Pi Node version 0.5.4, as the network moves closer to user-centric decentralization and prepares for the eventual transition beyond the current Enclosed Mainnet phase.
Pi has set March 1, 2026, as a deadline for all Mainnet nodes to upgrade, or they will lose connection to the network. This is described as “Step 2” in a series of infrastructure upgrades that pave the way toward a larger v20 release.
Pi Price Prediction February 2026
In February 2026, Pi’s price may attempt to maintain an average of $0.1532 and could rise to $0.1855 if downward pressure is not sustained. However, a bearish rejection could push the price down, leading to consolidation around a new minimum level of $0.1284.
| Pi Price Prediction | Potential Low | Potential Average | Potential High |
| Pi Price Prediction February 2026 | $0.1284 | $0.1532 | $0.1855 |
Pi Price Prediction 2026
In 2026, the price of 1 Pi is expected to reach a minimum level of $0.1320. The Pi price can reach a maximum level of $0.5695, with the average price expected to be $0.514 throughout the year.
| Pi Price Prediction | Potential Low ($) | Potential Average ($) | Potential High ($) |
| Pi Price Prediction 2026 | $0.1320 | $0.514 | $0.5695 |
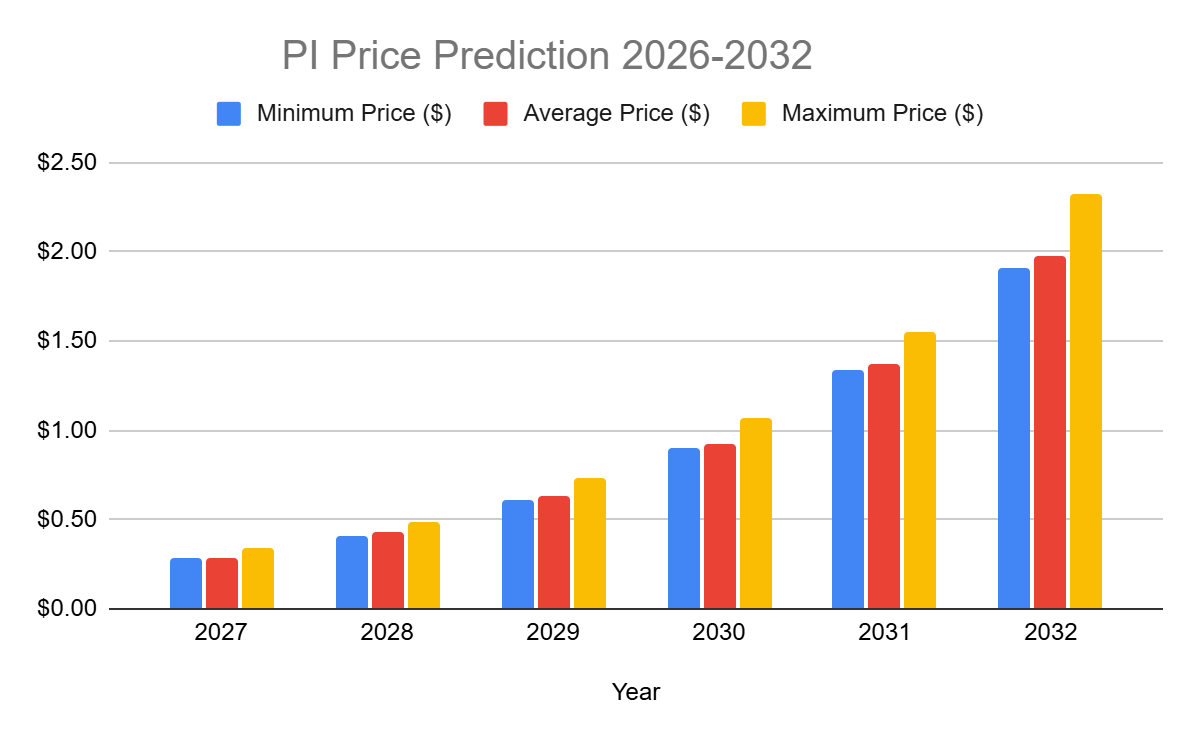
Pi Price Predictions 2027-2032
| Year | Minimum Price ($) | Average Price ($) | Maximum Price ($) |
| 2027 | $0.2824 | $0.2907 | $0.3441 |
| 2028 | $0.412 | $0.4265 | $0.4911 |
| 2029 | $0.6147 | $0.6318 | $0.7303 |
| 2030 | $0.9016 | $0.9269 | $1.07 |
| 2031 | $1.34 | $1.37 | $1.55 |
| 2032 | $1.91 | $1.98 | $2.32 |
Pi Price Prediction 2027
Pi price is forecast to reach a lowest possible level of $0.2824 in 2027. The PI price could reach a maximum possible level of $0.3441 with the average forecast price of $0.2907.
Pi Price Prediction 2028
In 2028, the price of Pi is predicted to reach a minimum level of $0.412. The PI price can reach a maximum level of $0.4911 with the average trading price of $0.4265.
Pi Price Prediction 2029
The price of Pi is predicted to reach a minimum level of $0.6147 in 2029. The Pi price can reach a maximum level of $0.7303 with the average cost of $0.6318 throughout 2029.
Pi Price Prediction 2030
The Pi price is forecast to reach a lowest possible level of $0.9016 by 2030. The PI price could reach a maximum possible level of $1.07, with the average forecast price of $0.9269.
Pi Price Prediction 2031
In 2031, the price of Pi is forecasted to be at around a minimum value of $1.34. The Pi price value can reach a maximum of $1.55, with the average trading value of $1.37 in USD.
Pi Price Prediction 2032
In 2032, the price of Pi is expected to reach a minimum price value of $1.91. The PI price can reach a maximum price value of $2.32, with the average value of $1.98.
Pi Network Price Prediction: Analysts’ Pi Price Forecast
| Firm Name | 2026 | 2027 |
| Coincodex | $ 0.2635 | $ 0.2068 |
| DigitalCoinPrice | $ 0.2310 | $ 0.2420 |
Cryptopolitan’s Pi Price Prediction
At Cryptopolitan, we remain constructively bullish on Pi’s long-term outlook, despite weak short-term momentum. Investors are keenly watching the Pi Network market to discern potential movements in its future price trends and analyse shifts in Pi Network’s price, seeking independent professional consultation for informed decisions.
In 2026, the price of 1 Pi is expected to reach a minimum level of $0.1320. The Pi price can reach a maximum level of $0.5695, with the average price expected to be $0.514 throughout the year.
Pi Historic Price Sentiment
- Pi Network launched in 2019 with a mobile mining model. During these years, it operated in a closed network with no official market price, as tokens couldn’t be traded externally.
- In 2023, the token was still largely unlisted on major exchanges. Price remained speculative, often appearing in unofficial markets with wide variances.
- By early 2024, the first signs of market traction were still limited. Prices ranged between $0.60 and $1.00 over-the-counter or in the sandbox.
- In February 2025, official market traction began. Pi hit its all-time high (ATH) of $2.98 on February 26 after initial listings or increased public speculation.
- In March 2025, the price dropped significantly when Pi Network had an unstable phase after the expiration of its final KYC verification deadline. Traded between $1.85 and $0.90, gradually declining through the month.
- In April 2025, Pi Network hit its all-time low (ATL) of $0.4012 on April 5. Prices ranged between $0.40 and $0.65, showing weak recovery momentum.
- In May 2025, the Pi Network surged toward $1.67 but failed to maintain its buying demand. This resulted in a significant downward pressure toward $0.75 by the end of the month.
- In June, Pi showed a sideways-to-bullish movement, with the potential to break above $0.66 and target $0.72.
- At the start of July 2025, Pi Network faced high volatility as massive token unlocks triggered strong selling pressure, keeping prices around the $0.458–$0.50 range.
- On July 19, 2025, PIUSDT declined slightly to $0.4412, reflecting short-term bearish pressure.
- On July 26, 2025, PIUSDT continued to hover under pressure around $0.4409, staying within a tight trading range as momentum remained subdued.
- for August 2, 2025. Pi traded at $0.3496, still under pressure and at its all-time low.
- On August 6, 2025, Pi Network traded at around $0.3410, showing moderate consolidation with weak momentum and limited price movement.
- On August 9th, Pi/USDT went up from its early August low of $0.3766 and traded around $0.4103.
- August 17th, 2025, the Pi Network (PI) traded at $0.387, showing slight movement between support at $0.383 and resistance at $0.390.
- On August 21, Pi Network (PI) traded near $0.366, showing a modest 1.39% gain as buyers attempted a short-term recovery.
- On September 2, 2025, Pi network traded around $0.34, just above its past month’s August all-time low of $0.3304.
- On September 22, 2025, Pi crashed to a new all-time low (ATL) of $0.2234, marking a –92% drop from its February ATH and reflecting heavy sell-side pressure from token unlocks and weak demand.
- Pi rebounded slightly, to trade between $0.25 and $0.28 through late September, though resistance at $0.30 continued to hold firmly.
- At the start of October 2025, Pi trades at $0.2718, but is still struggling under bearish sentiment as buyers attempt to defend support above $0.26 while momentum indicators suggest only a weak recovery.
- On October 11, 2025, Pi Network hit a new all-time low of $0.1585, reflecting the peak of a prolonged market crash and severe selling pressure.
- On October 15, 2025, Pi Network (PI) stabilized slightly, trading around $0.1884, as short-term buyers stepped in following the sharp October 11 crash.
- On October 28, 2025, PI attempted a short rebound toward $0.238, but failed to hold gains, slipping back below the 20-day moving average.
- As of the start of November 2025, Pi Network traded at approximately $0.247, still below key resistance at $0.26, as traders remain cautious ahead of the upcoming 120 million token unlock expected in November.
- As of November 15, Pi network traded at $0.223. This rise for 1 day was driven by technical breakout signals, whale accumulation, and ongoing ecosystem updates.
- As of November 30, 2025, Pi Network traded around $0.243, consolidating above the $0.24 support zone while still below the $0.26 resistance heading into month-end.
- As of December 1, 2025, Pi Network had dropped to about $0.226, as sellers reacted to December’s 190M PI token unlock overhang and a broader risk-off mood in the crypto market.
- As of December 16, 2025, Pi Network traded around $0.196, having broken below the psychological $0.20 support as ongoing token unlocks, legal uncertainty, and sustained bearish technical momentum kept strong downside pressure on the price.
- As of late December 2025, Pi Network traded in the low-$0.20 range around $0.205, moving sideways as selling pressure eased, but trading volume stayed light, and buyers remained cautious after the mid-month dip below $0.20.
- At the start of 2026, Pi continued to hover near the $0.20–$0.21 zone, showing early stabilization above the key $0.20 level, with the market still weighing ongoing supply unlocks against slower demand growth.
- On January 15, 2026, Pi traded around $0.205 and closed near $0.2046 after slipping from the $0.21 area, showing a controlled pullback with buyers still defending the low-$0.20 zone.
- By the end of January 2026, Pi Network was holding in the mid-$0.16 range, with rebounds capped below $0.18 as bearish momentum and oversold conditions kept price action fragile.
- As of February 11, 2026, Pi Network hit a new all-time low (ATL) of $0.1312.


Read More