Key Takeaways:
- Pi’s price is volatile below $0.110.
- Our Pi network price prediction anticipates the Pi price reaching a maximum of $0.3695 by 2026.
- In 2032, the Pi price prediction projects a maximum of $1.71.
Pi Network price analysis points to a volatile but potentially higher long-term trajectory, with Pi Network’s maximum price predicted at $0.3695 by 2026 and $1.71 by 2032. That outlook is most applicable to current Pi holders, investors who may be thinking about investing in it, or crypto enthusiasts who just want to know if the recent downturn in Pi has affected its future potential.
It was originally launched as a mobile-first cryptocurrency to provide easy access to digital assets for the average user. Since its launch, PI has surged to its all-time high of $2.98 in February 2025. Later, PI experienced volatility due to market sentiment and has recently dropped to a new all-time low of $0.0805 in July 2026 amid increased selling pressure.
Pi Network has recently been shifting its focus to ecosystem growth and the enhancement of infrastructure. The project introduced improvements to the Pi ecosystem by implementing upgrades to Protocol v24, Pi Nodes update expansion, and new Pi2Day products such as PiVerify, Pi Sign-in, and SoloHost to improve real-world utility across the ecosystem.
With PI trading in a volatile manner and the project still evolving, understanding its historical trend, technical outlook, 2026-2032 forecasts, project development, and key risks and opportunities can help readers make more informed decisions about this highly speculative token.
As Pi Network continues growing its ecosystem and user activity, questions are growing around its long-term value. Will PI bounce back from its recent lows, and where will the token go in the next few years? Let’s explore our Pi Network price prediction and technical analysis from 2026 to 2032.
Overview
| Cryptocurrency | Pi Network |
|---|---|
| Ticker Symbol | Pi |
| Price | $0.09033 |
| Price Change 24h | 5.33% (24h) |
| Market Cap | $984.62M |
| Circulating Supply | 10.94B P |
| Trading Volume 24h | $23.99 million |
| All-Time High | $2.98, Feb 26, 2025 |
| All-Time Low | Jul 13, 2026: $0.08025 |
Pi Network Price Prediction: Technical Analysis
| Metric | Value |
|---|---|
| Current Price | $0.09033 |
| Price Prediction | $0.08553 (-25.06%) |
| Fear & Greed Index | 11 (Extreme Fear) |
| Market Sentiment | Bearish |
| Volatility | 4.87% (Medium) |
| Green Days | 10/30 (33%) |
| 50-Day SMA | $ 0.1394 |
| 200-Day SMA | $ 0.1728 |
| 14-Day RSI | 28.03 (Oversold) |
Pi price analysis
TL;DR Breakdown:
- Pi price analysis shows bearish pressure as PI trades around $0.1154
- The token is down 5.33% over the last 24 hours despite rebounding nearly 25% from its recent all-time low
- The immediate support is around the $0.110 level, while resistance is located at $0.120
As of July 21, 2026, Pi Network is trading under renewed selling pressure, losing momentum from its recent recovery. PI has bounced back from its record low by about 25%, but now sellers are back in the market, bringing its price down by 5.33% in the last 24 hours. At the time of writing, the token is trading around $0.09033 and remains bearish today, with sellers in control.
PI price analysis on the daily timeframe
Analyzing the daily chart, Pi has been under selling pressure despite its rebound from its all-time low. Although buyers managed to lift the price from the record low, the recovery has stalled below $0.12, indicating that bulls are struggling to build momentum. Immediate support is around $0.110, and the first major resistance is near $0.120. A breakdown above this level may open the way toward $0.13, while losing support may expose PI to another decline.
Trading volume has cooled off and dropped to $23.99 million, down 35.17%, suggesting buying momentum has reduced after the recent recovery. The overall trend continues to be bearish as Pi is still trading well below the 50-day SMA and the 200-day SMA.
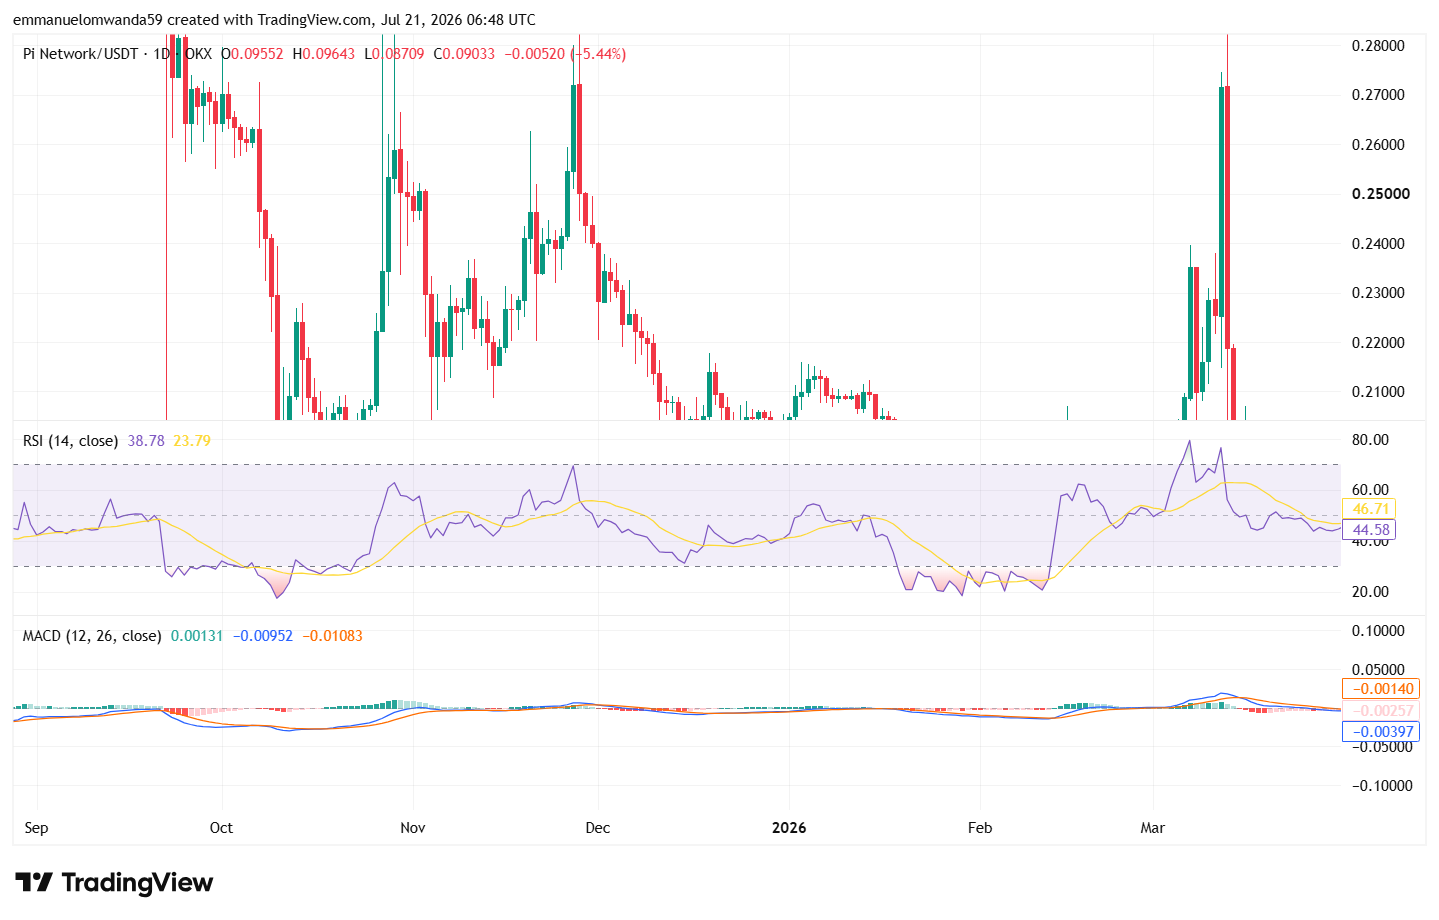
The Relative Strength Index (RSI) has recovered to around 38.78, climbing out of oversold territory. This is a sign that selling pressure has eased a bit from last week, but the indicator is still below the neutral 50, meaning buyers haven’t taken control yet.
The MACD remains bearish, with the MACD line still below the signal line. However, the gap between the two lines is narrowing, indicating bearish momentum is weakening, and a market could stabilize if buying demand continues to improve.
Pi Price Analysis 4-Hour Chart
The 4-hour chart shows Pi is losing part of its recent recovery after failing to hold above the $0.10 level. The latest rejection has seen Pi retreat to roughly $0.0905, and sellers have taken short-term control. Despite this, the price is still above last week’s swing low, indicating that the bulls are still defending the broader recovery from the all-time low.
On the 4-hour chart, immediate support is around $0.087, while the resistance is near $0.100. A move above $0.100 could allow PI to retest the $0.105 area, whereas a break below support may put PI back into focus at $0.080.
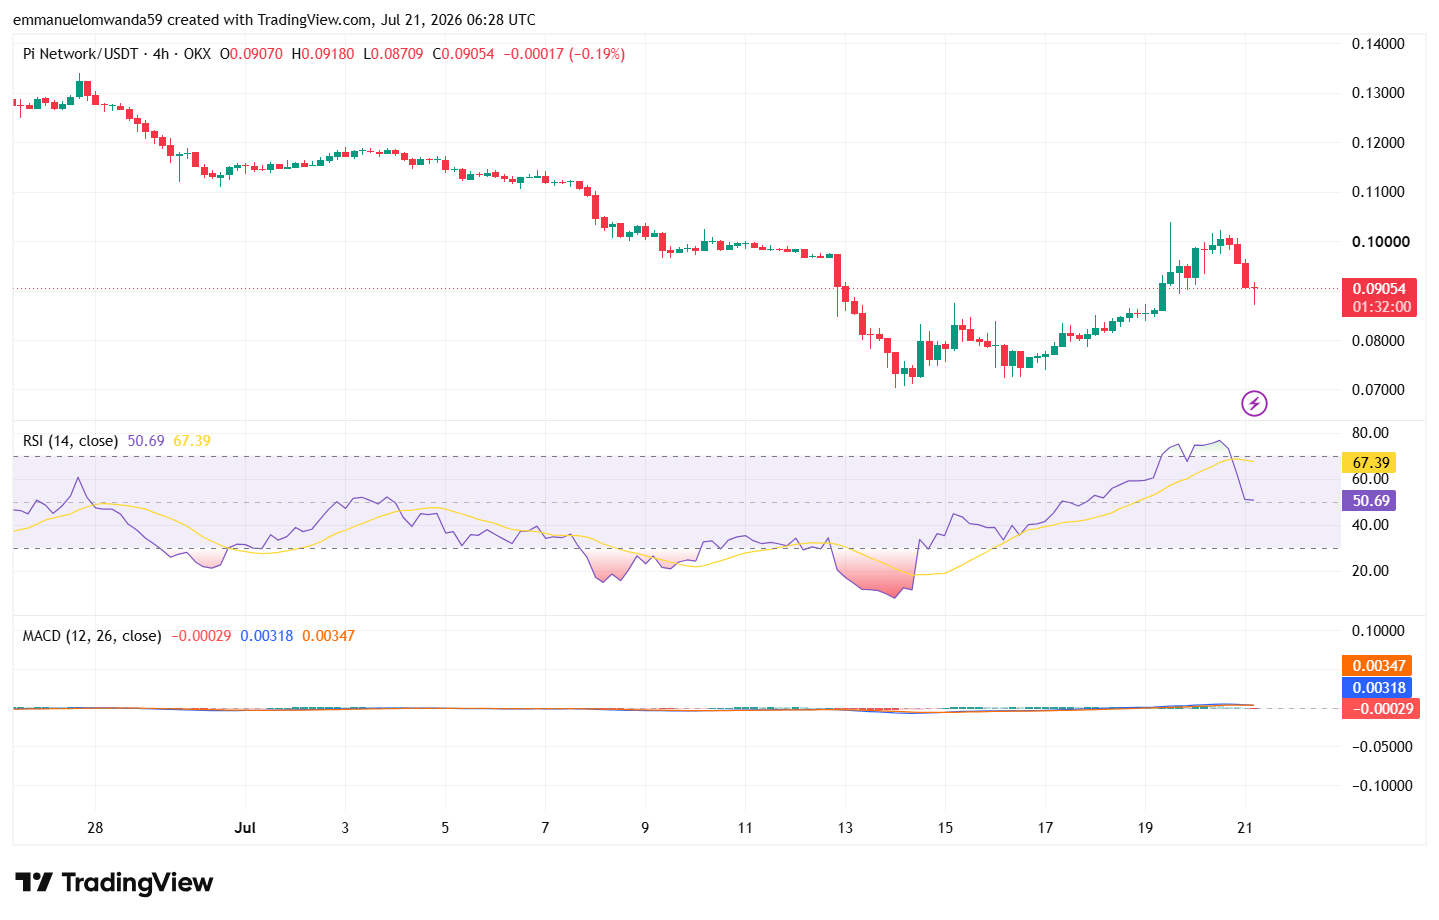
The RSI on the short-term time frame has dropped to around 50.7 after recently reaching overbought levels above 70. This shows bullish momentum has cooled, but the indicator remains in neutral territory, suggesting buyers have not completely lost control.
The MACD is still in positive territory, with the MACD line still above the signal line. However, the histogram is flattening, indicating bullish momentum is fading, and the market could continue consolidating unless fresh buying pressure returns.
Pi Network Price Prediction: Levels and Action
Daily Simple Moving Average (SMA)
| Period | Value | Action |
|---|---|---|
| SMA 3 | $0.1190 | SELL |
| SMA 5 | $0.1229 | SELL |
| SMA 10 | $0.1265 | SELL |
| SMA 21 | $0.1292 | SELL |
| SMA 50 | $0.1394 | SELL |
| SMA 100 | $0.1575 | SELL |
| SMA 200 | $0.1728 | SELL |
Daily Exponential Moving Average (EMA)
| Period | Value | Action |
|---|---|---|
| EMA 3 | $0.1186 | SELL |
| EMA 5 | $0.1211 | SELL |
| EMA 10 | $0.1247 | SELL |
| EMA 21 | $0.1289 | SELL |
| EMA 50 | $0.1394 | SELL |
| EMA 100 | $0.1538 | SELL |
| EMA 200 | $0.1924 | SELL |
Traders also use Fibonacci retracement and other technical indicators with EMAs to assess support, resistance, and possible pullbacks in the coming days or over the next week.
What to expect from the next Pi price analysis?
Pi is trying to build a base after rebounding from its all-time low, but it must reclaim $0.120 to improve the short-term outlook. If support at $0.110 breaks, sellers could regain control and push the token lower again.
Why is PI’s price down today?
Pi fell 5.33% to around $0.0906, underperforming a broader crypto market that moved higher as weak buying interest and the absence of positive catalysts kept sellers in control. In the near term, holding above the $0.0900 support is crucial, while a move above $0.0925 could signal the start of stabilization.
Is Pi a Good Investment?
Pi is not a good buy for cautious investors, and those considering whether to buy Pi Network should treat it as a high-risk, speculative investment that could offer upside if its ecosystem grows and adoption increases. However, its price volatility remains high and dependent on overall market conditions, so investors should be prepared for uncertainty.
The project’s long-term success will largely depend on factors such as Mainnet adoption, developer activity, ecosystem utility, exchange accessibility, and the network’s ability to attract and retain active users. Recent developments, including Pi App Studio enhancements, protocol upgrades, and expanding exchange support, have strengthened the project’s fundamentals, but current trading for Pi remains limited because of the project’s enclosed mainnet, while supply expansion is a major risk because token inflation runs at approximately 20% monthly, or about 174 million PI, which pressures the price, alongside market sentiment challenges.
As with any cryptocurrency investment, investors should conduct their own research, assess their risk tolerance, and avoid investing more than they can afford to lose. While Pi has growth potential if adoption continues to expand, it remains a speculative asset with significant upside and downside risks.
Will Pi Price Reach $5?
At the current pace of development and given its total PI supply and circulating supply of over 8 billion PI, Pi Network’s long-term value will largely depend on user base growth and broader acceptance of cryptocurrencies in mainstream finance, making $5 unlikely in the near term. In that context, Pi Network compares unfavorably with more established blockchain networks on current adoption and practical utility, even as its mobile-first model has attracted broad early interest. The maximum supply of Pi tokens is 100 billion, and ongoing unlocks create significant selling pressure that must be absorbed by demand, while ecosystem growth remains high risk unless developers and users create real utility through DApps or merchant integrations.
Multiple technical quantitative indicators and fundamental factors, such as delayed mainnet launch and maximum supply constraints, suggest that Pi’s price may fluctuate within lower ranges before any major uptrend. Real-world utility will be crucial for supporting demand and helping determine whether Pi can reach higher price targets. A $5 target would require sustained adoption, significant on-chain activity, and strong market demand that is not yet present.
Will Pi Reach $10?
Reaching $10 would represent a massive increase in Pi’s market cap, something that is not expected soon under current crypto market conditions. The $10 mark is considered an upper price target or the high end of speculative forecasts. One forecast model puts the predicted price for Pi Network between $0.14 and $0.56 by the end of 2026, calculated from current market conditions and technical analysis.
Analysts suggest that even optimistic forecasts place this milestone more than a decade away, if at all. Investors should treat such projections as speculative investment advice and conduct their own research before making investment decisions, as Pi remains a high-risk asset with uncertain long-term value.
Does Pi Network Have a Good Long-Term Future?
Pi Network’s long-term prospects depend on its ability to convert its claimed base of over 60 million total users into active ecosystem participants, alongside a KYC-verified community the project puts at 11 million pioneers, though some reports cite 18.1 million KYC-verified users. If developer adoption, merchant integration, and real-world use cases continue to expand, the project could strengthen its position within the cryptocurrency market, but engagement and retention still matter because sentiment can influence long-term adoption.
However, investors should also consider risks related to token supply growth, market competition, regulatory developments, and overall crypto market conditions. As with any digital asset, future performance will
Recent Pi News/Opinions
Kraken listed PI for trading on March 13, 2026, marking one of the clearest exchange efforts to list PI.
On June 28, Pi Network celebrated its annual Pi2Day by launching three products aimed at extending its services to external developers and businesses. The releases are SoloHost (a framework for locally run AI apps), Pi Sign-in (a decentralized login system), and PiVerify (a KYC verification service for external clients). The Core Team’s theme was “Extending Pi Resources outside the Pi Ecosystem.”
Recent on-chain analysis from PIScan highlights a stark concentration of PI tokens. Only 21 wallets hold over 10 million PI each, with the Pi Foundation’s largest wallet reportedly controlling over 52 billion PI. In contrast, over 80% of the 16.7 million migrated users hold fewer than 10 tokens. This disparity challenges the project’s narrative of accessibility and decentralization
Pi Network announced that Pi App Studio has introduced a new App Planning Phase feature that uses AI to help creators refine their app ideas before generation. The feature guides users by requesting more details about the app’s main idea, goals, design, and user experience, making the app creation process more interactive and structured.
Pi Network has confirmed that Protocol v25 will launch on July 22, introducing improvements focused on network stability, reliability, and support for privacy-preserving smart contracts through BN254 cryptography and Poseidon hashing. The upgrade will first roll out on the testnet and is designed to support future node enhancements, open-source development, and the network’s planned decentralized exchange (DEX) ecosystem.
Pi Price Prediction July 2026
In July 2026, Pi’s price may average around $0.0906 as bearish market sentiment and weak demand continue to pressure the token following its recent all-time low. A short-term recovery toward $0.1201 could occur if buying activity improves, while continued selling pressure may push PI toward a monthly low near $0.0797. Based on current short-term data, Pi Network’s price is predicted to decrease to $0.08754 by July 29, 2026.
| Pi Price Prediction | Potential Low | Potential Average | Potential High |
|---|---|---|---|
| Pi Price Prediction July 2026 | $0.0797 | $0.0906 | $0.1201 |
Pi Price Prediction 2026
In 2026, Pi Network (PI) is anticipated to trade between $0.07845 and $0.3695, leading to an average annualized price of around $ 0.2239. Based on pi today, that range implies both downside risk toward the low end and upside potential toward the high end from current levels if market sentiment and ecosystem growth improve during the year.
| Pi Price Prediction | Potential Low ($) | Potential Average ($) | Potential High ($) |
|---|---|---|---|
| Pi Price Prediction 2026 | $0.07845 | $0.2239 | $0.3695 |
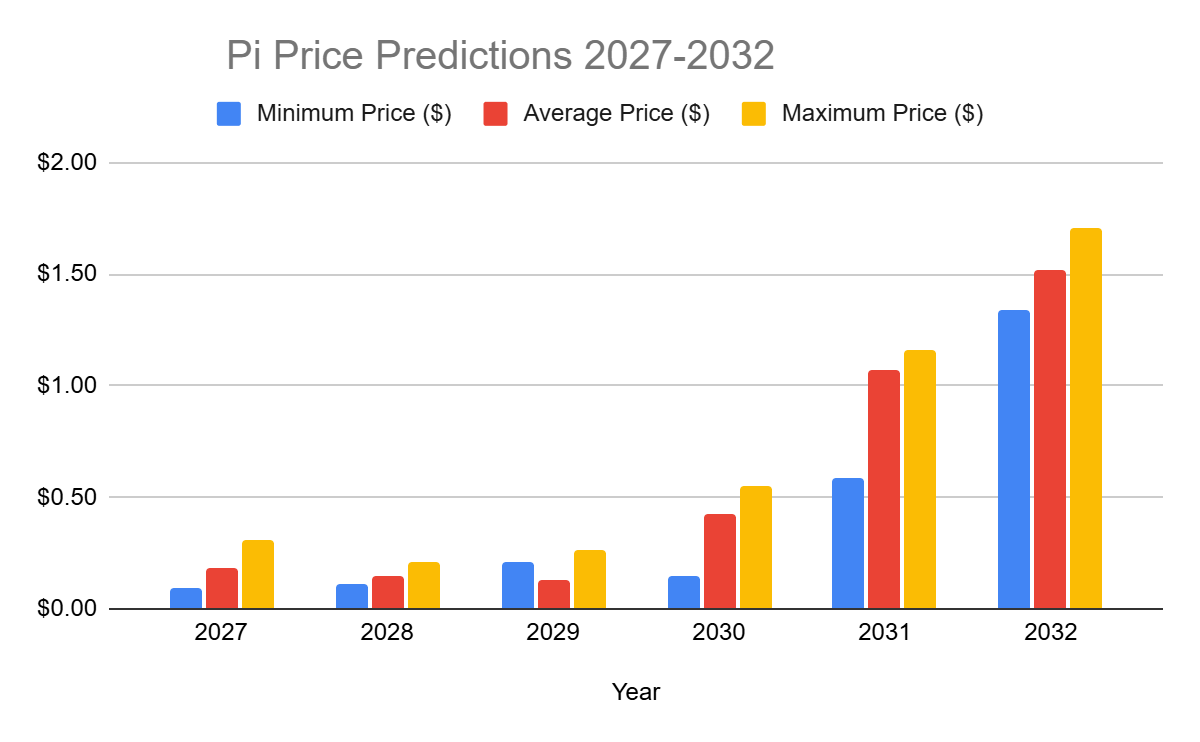
Pi Price Predictions 2027-2032
| Year | Minimum Price ($) | Average Price ($) | Maximum Price ($) |
|---|---|---|---|
| 2027 | $0.08973 | $0.1814 | $0.3127 |
| 2028 | $0.1078 | $0.1462 | $0.2074 |
| 2029 | $0.2124 | $0.1296 | $0.2656 |
| 2030 | $ 0.1490 | $0.4216 | $0.5547 |
| 2031 | $0.5825 | $1.07 | $1.16 |
| 2032 | $1.34 | $1.52 | $1.71 |
Pi Price Prediction 2027
In 2027, the price of Pi is expected to reach a minimum level of $0.0897. The PI price could climb to a maximum of $0.3127, with an average trading price of $0.1814 throughout the year.
Pi Price Prediction 2028
In 2028, Pi is forecast to trade at a minimum value of $0.1078. The PI price may reach a maximum of $0.2074, while the average trading price could settle around $0.1462.
Pi Price Prediction 2029
In 2029, Pi’s price is projected to reach a minimum of $0.1296. The PI price could rise to a maximum of $0.2656, with an average trading price of $0.2124 during the year.
Pi Price Prediction 2030
In 2030, Pi is expected to trade at a minimum price of $0.1490. The PI price may reach a maximum of $0.5547, with an average forecast price of $0.4216.
Pi Price Prediction 2031
In 2031, Pi’s price is forecast to hold a minimum value of $0.5825. The PI price could climb to a maximum of $1.16, with an average trading value of $1.07.
Pi Price Prediction 2032
In 2032, Pi is expected to reach a minimum price of $1.34. The PI price could rise to a maximum of $1.71, with an average value of $1.52.
Pi Network Price Prediction: Analysts’ Pi Price Forecast
| Firm Name | 2026 | 2027 |
|---|---|---|
| Coincodex | $0.1468 | $0.1468 |
| DigitalCoinPrice | $ 0.2310 | $ 0.2420 |
Cryptopolitan’s Pi Price Prediction
At Cryptopolitan, we remain cautiously bullish on the long-term outlook for Pi Network despite recent volatility in the cryptocurrency market. Based on our Pi Network price prediction, the current price could gradually recover as ecosystem adoption, trading volume, market capitalization, and utility continue to grow. Earlier pre-launch Pi values reflected derivatives-style trading rather than true price discovery.
Our forecast suggests PI could trade between $ 0.07845 and $ 0.3695, with an average price of $0.2239. However, future price movements will depend on market sentiment, circulating supply growth, technical analysis indicators, and how Pi Network work in live market trading rather than enclosed-network conditions, as well as the network’s ability to attract users, developers, and real-world applications.
Pi Historic Price Sentiment
- Pi Network launched in 2019 with mobile mining and operated in a closed ecosystem with no official market price, as tokens couldn’t be traded externally.
- Between 2023 and 2024, Pi remained unlisted, with speculative prices ranging between $0.60 and $1.00 in unofficial markets.
- In 2025, Pi Network surged to its all-time high of $2.98 in February before entering a prolonged decline that pushed the price to $0.1585 by October. The token later stabilized between $0.20 and $0.26 toward the end of the year..
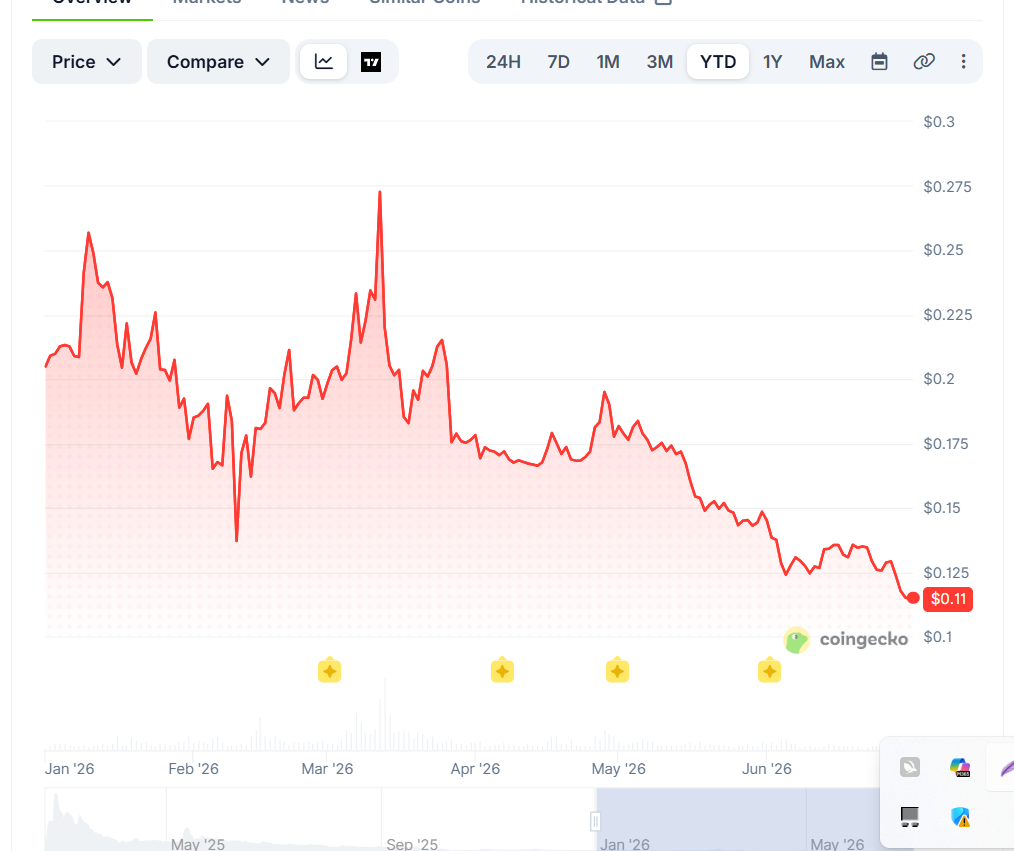
- From January to March 2026, Pi Network fell to a new all-time low of $0.1312 before recovering gradually toward the $0.17–$0.19 range as market stability improved.
- By May 2026, Pi Network declined from the $0.17–$0.18 range to around $0.1439, as weak market momentum and continued selling pressure weighed on the token throughout the month.
- By June 30, 2026, Pi Network hit a new all-time low of $0.1127.
- By July 2026, Pi Network plunged to a fresh all-time low of $0.1025, extending its prolonged downtrend as persistent selling pressure and weak market sentiment pushed the token below the key $0.11 support level.


Read More