


The PUMP price trades near $0.0062 at press time on September 12, up almost 6% in the past 24 hours. Week-on-week gains stand at 42.7%, and the token is less than 7% below its all-time high at $0.0068. The rally looks powerful, but early signs suggest the move may cool before pushing higher.
These signals do not point to a full reversal. Instead, they suggest a short breather — a pause that could prepare the ground for a fresh breakout into new highs.
Signs Of Fatigue, But Bulls Still Hold Control
Since September 8, PUMP’s latest upward leg has been running strong. But momentum indicators show the rally may slow before continuing.
The Money Flow Index (MFI) is a momentum tool that blends both price and trading volume. When MFI climbs, it means strong inflows are supporting the rally. When it drops or flattens, it shows that money is no longer entering the market as quickly, even if the token’s price is still rising.
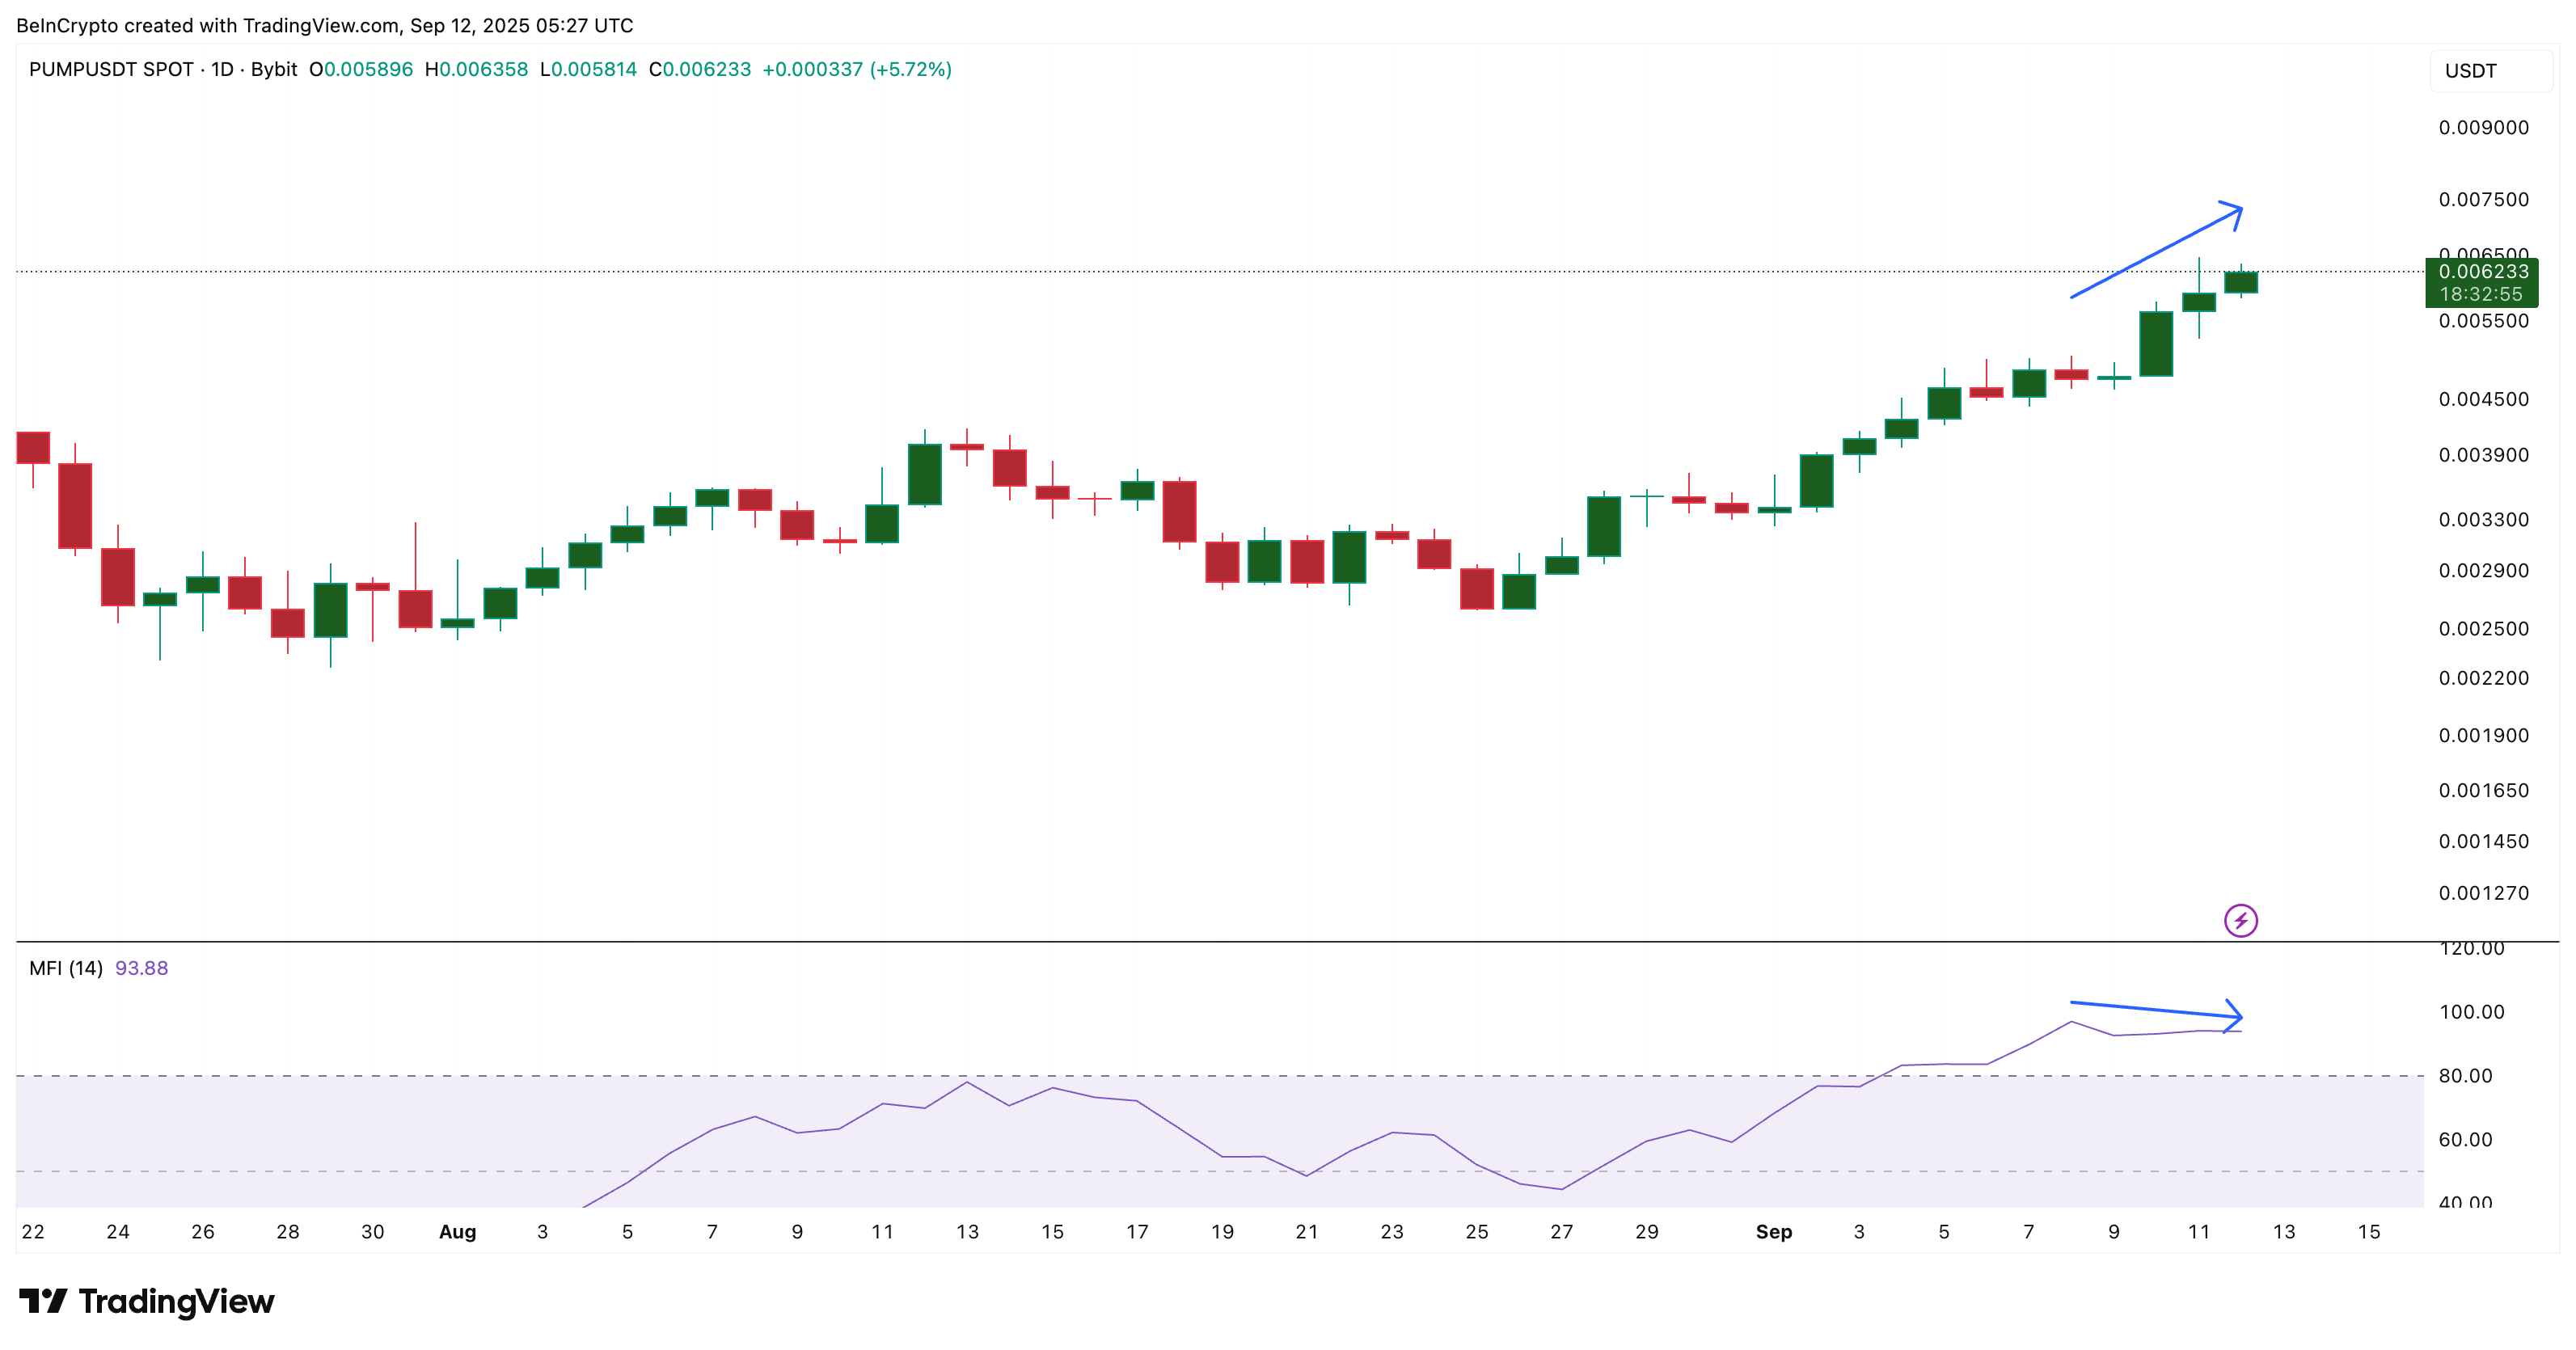
That’s exactly what has happened here. As the PUMP price kept pushing higher as part of its latest leg that started after September 8, MFI trended lower and has now gone flat for the past two daily sessions.
This divergence often signals that new buyers are waiting for better entry levels instead of chasing higher prices. The result is usually a pause or small pullback rather than a collapse.
Want more token insights like this? Sign up for Editor Harsh Notariya’s Daily Crypto Newsletter here.
Despite the slowdown in momentum, the Bull-Bear Power indicator — which compares buyer and seller strength — remains tilted in favor of buyers, with green pillars still dominating the chart.
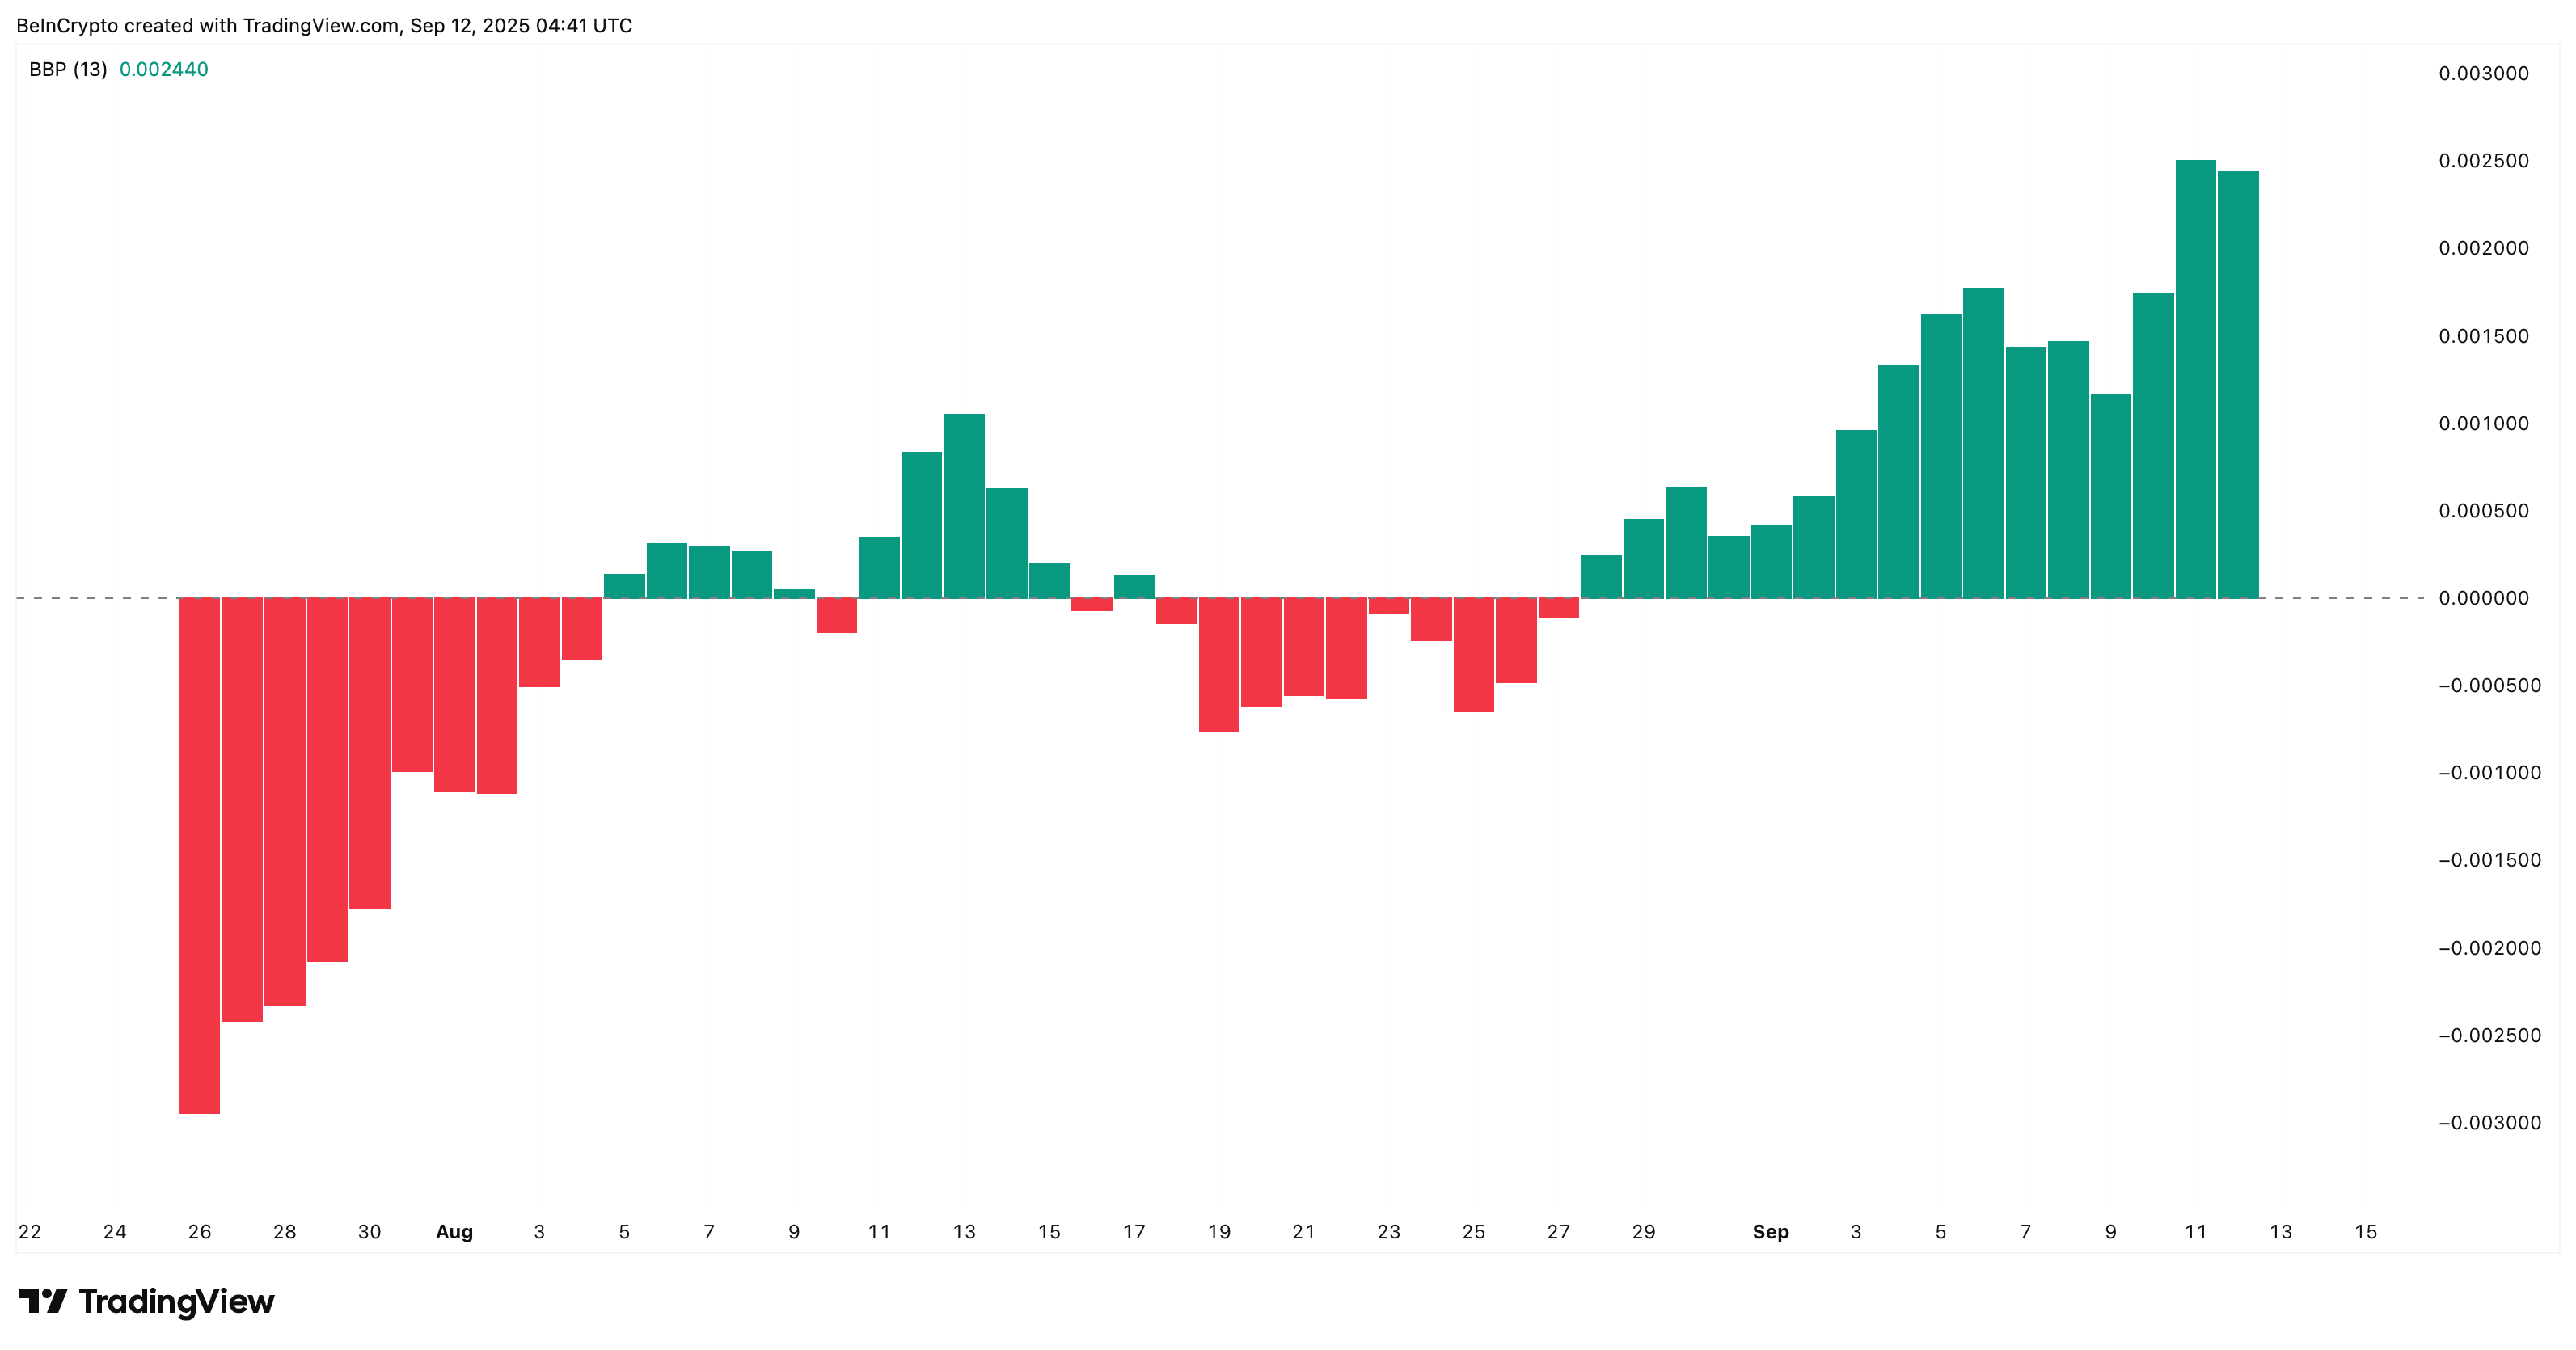
The size of these pillars shows buyers are holding control in a significant way. This means bulls continue to drive the market structure, even as momentum indicators like the MFI suggest the rally may pause briefly.
PUMP Price Breakout Setup Intact, But One Metric Suggests A Pause First
The broader price structure supports the broader bullish outlook. On the 4-hour chart, Pump.fun (PUMP) trades inside an ascending channel, a bullish formation that usually breaks upward. The setup shows room for another leg higher, but short-term signals suggest the move could take a breather first.
The Relative Strength Index (RSI) helps explain why. RSI measures the speed and size of recent price changes to show whether an asset is overbought or oversold.
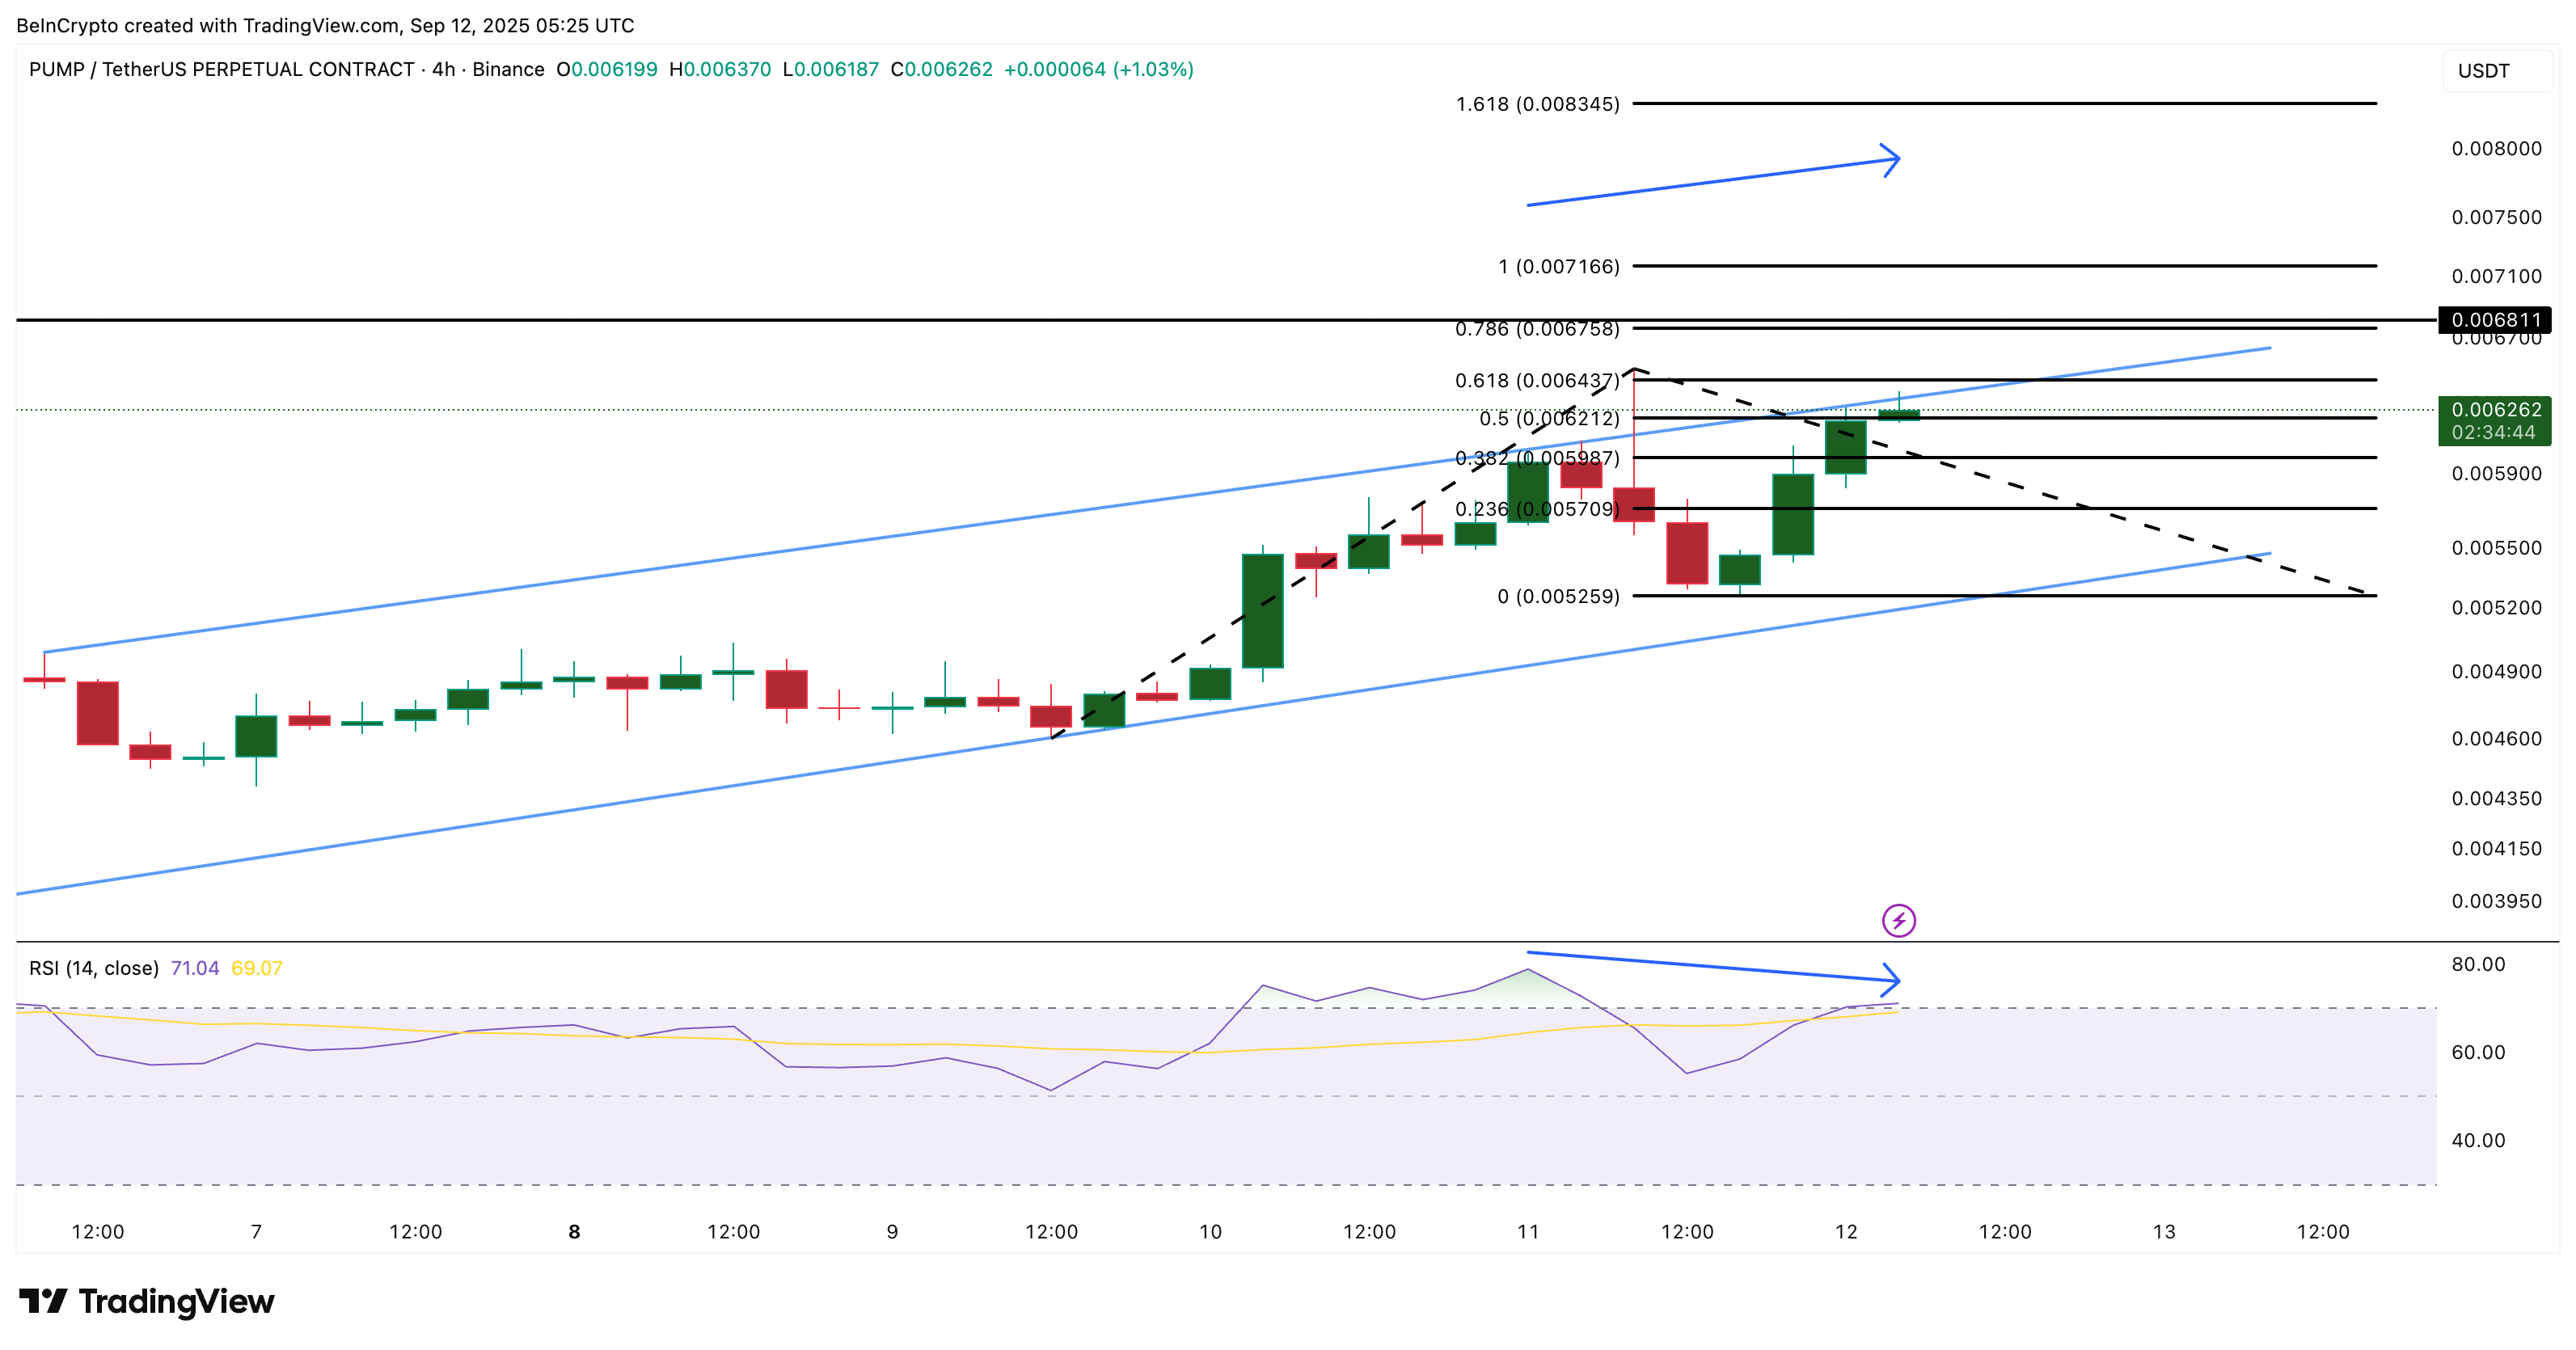
Since September 10, the PUMP price has made higher highs, while RSI has made lower highs. This is called a bearish divergence. On shorter timeframes, such as the 4-hour chart, this typically indicates a pullback or sideways movement rather than a complete reversal. Essentially, it signals that momentum is lagging behind price.
If such a pullback occurs, support zones are located near $0.0059 and $0.0057. Holding these levels would reset momentum and cancel out the divergence.
But if PUMP clears a clean 4-hour candle close above $0.0064, momentum would confirm again, opening a path to retest the all-time high above at $0.0068. Post that, the key targets, in the price discovery zone, sit around $0.0071 and potentially $0.0083
The post PUMP Price Now Eyes Fresh All-Time High but Could Pause for a Quick Break First appeared first on BeInCrypto.


Read More