


Key takeaways:
- Our SEI price prediction anticipates a high of $0.14 by the end of 2026.
- In 2028, it will range between $0.35 and $0.43, with an average price of $0.36.
- In 2030, it will range between $0.78 and $0.91, with an average price of $0.81.
The Parallel Stack, a robust, open-source framework designed for crafting rollups and Layer 2s that harness parallel processing, is now on SEI V2. The stack enhances Ethereum’s performance by addressing the most common bottlenecks Layer 2 blockchains face. Such developments are anticipated to drive SEI value over the long term.
Regarding price performance, SEI shows signs of trading higher; however, it remains influenced by broader market sentiment. How high will SEI go? Is SEI a good investment? What will SEI’s value be in 2026? Will SEI rise? Read on and discover the SEI price prediction from 2026 to 2032.
Overview
| Cryptocurrency | Sei |
| Ticker | SEI |
| Current price | $0.04796 |
| Crypto market cap | $351.98M |
| Trading volume | $20M |
| Circulating supply | 7.33B |
| All-time high | $1.14 March 16, 2024 |
| All-time low | $0.007989 on Aug 15, 2023 |
| 24-hour high | $0.0491 |
| 24-hour low | $0.04729 |
SEI price prediction: Technical analysis
| Metric | Value |
| Volatility (30-day variation) | 5.53% (High) |
| 50-day SMA | $0.05377 |
| 200-day SMA | $0.07091 |
| Sentiment | Bearish |
| Green days | 14/30 (47%) |
| Fear and Greed Index | 22 (Extreme Fear) |
SEI price analysis
On July 15, SEI’s price rose 0.36% over the past 24 hours and is down 13.54% over the past 30 days. Its 24-hour trading volume rose 27.07% to $20 million, signaling high conviction in the market trend.
SEI 1-day chart analysis
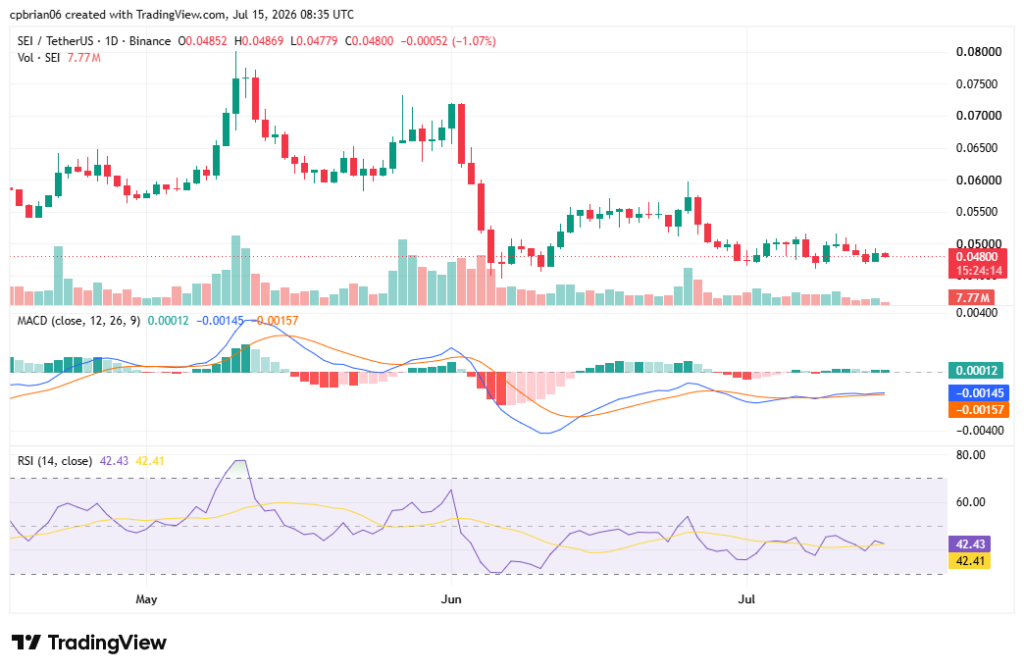
The chart shows SEI’s price has broken below most moving averages after bouncing off resistance at $0.07191. Its MACD histogram shows that momentum has turned positive, while rising trading volumes signal strong market interest. Traders are waiting to see if SEI will reclaim $0.05.
SEI price 4-hour chart price analysis
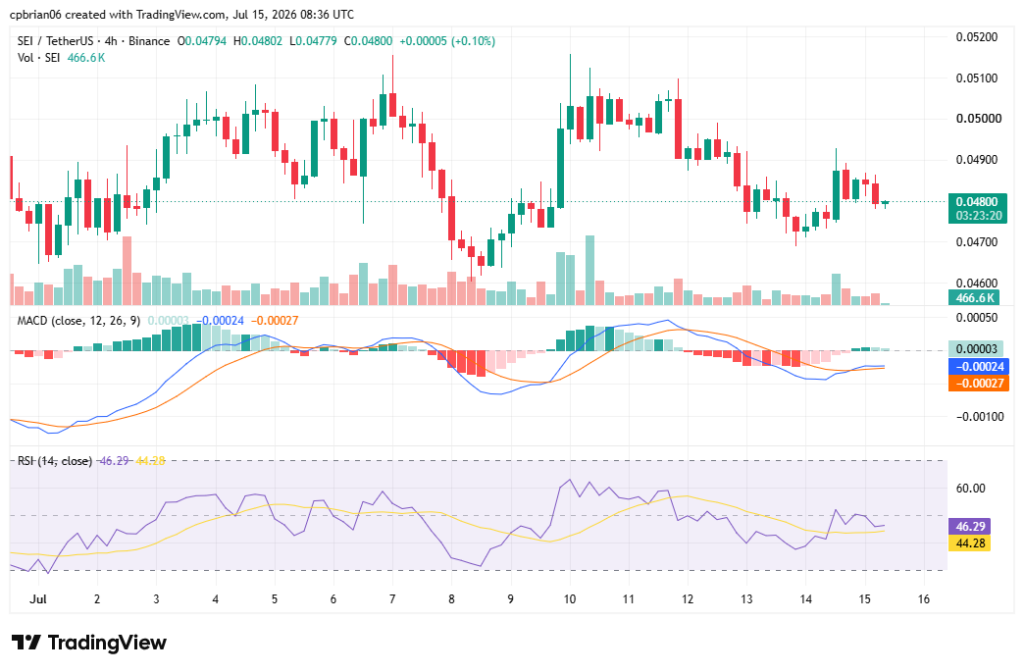
The 4-hour chart highlights SEI’s run this month. The trend is characterized by market volatility, as evidenced by the candle formation. SEI is neutral in this timeframe, with the RSI at 46.29.
SEI technical indicators: Levels and action
Daily simple average (SMA)
| Period | Value ($) | Action |
| SMA 3 | 0.04821 | SELL |
| SMA 5 | 0.04883 | SELL |
| SMA 10 | 0.04896 | SELL |
| SMA 21 | 0.04998 | SELL |
| SMA 50 | 0.05377 | SELL |
| SMA 100 | 0.05703 | SELL |
| SMA 200 | 0.07091 | SELL |
Daily exponential moving average (EMA)
| Period | Value ($) | Action |
| EMA 3 | 0.04795 | BUY |
| EMA 5 | 0.04831 | SELL |
| EMA 10 | 0.04881 | SELL |
| EMA 21 | 0.04997 | SELL |
| EMA 50 | 0.05303 | SELL |
| EMA 100 | 0.05919 | SELL |
| EMA 200 | 0.08411 | SELL |
What to expect from SEI price analysis next?
SEI is neutral, with rising trading volumes and positive momentum. All indicators point to a further drop, despite trading in neutral territory on the shorter timeframes.
Why is SEI up?
The entire crypto market cap rose 2.89%, with Bitcoin gaining 3.19%. Sector-wide altcoin pressure, with multiple low-cap tokens posting steep gains, indicates a risk-on rotation towards speculative assets.
Recent news
Sei has officially joined the Mastercard Crypto Partner Program. The move comes just before the release of a joint paper by Mastercard and Sei, which will introduce new blockchain evaluation frameworks tailored for financial services.
Will SEI reach $1?
According to the Cryptopolitan price prediction, SEI will rise above $1 in 2031, reaching a high of $1.37.
Can Sei Coin reach $10?
Per the Cryptopolitan price prediction, SEI is unlikely to reach $10 before 2031. With a maximum token supply of 10 billion, SEI would need enormous market cap growth to support a $10 price.
Will SEI reach $100?
Per the Cryptopolitan price prediction, SEI is unlikely to reach $100 before 2031.
Does SEI have a good long-term future?
According to Cryptopolitan price predictions, SEI will trade higher in the years to come. However, factors like market crashes or difficult regulations could invalidate this bullish theory
Is SEI a good investment?
SEI has growing utility, and its EVM compatibility helps it steal market share from Ethereum. While the technical analysis is bearish, price predictions paint a different picture, though the outlook for this asset also depends on overall market sentiment, institutional crypto adoption, and macroeconomic trends. Momentum also relies on fundamental growth metrics such as developer activity and TVL, so investors should do thorough research.
SEI price prediction June 2026
SEI will average at $0.06 in June. The price will range between $0.05 and $0.10.
| Month | Potential low ($) | Potential average ($) | Potential high ($) |
| June | $0.045 | $0.066 | $0.098 |
SEI price prediction 2026
This year, SEI will trade between $0.04 and $0.14, with an average of $0.09. The broader 2026 outlook implies roughly -15% ROI for the year despite expected volatility.
| Year | Potential low ($) | Potential average ($) | Potential high ($) |
| 2026 | 0.0438 | 0.0858 | 0.1378 |
SEI price prediction 2027 – 2032
| Year | Potential low ($) | Potential average ($) | Potential high ($) |
| 2027 | 0.1459 | 0.2529 | 0.2946 |
| 2028 | 0.3539 | 0.3640 | 0.4261 |
| 2029 | 0.5210 | 0.5392 | 0.6199 |
| 2030 | 0.7849 | 0.8065 | 0.9054 |
| 2031 | 1.1300 | 1.17 | 1.3700 |
| 2032 | 1.6600 | 1.7200 | 2.0200 |
SEI crypto price prediction 2027
The SEI forecast climbs higher into 2027. It will range between $0.1459 and $0.2946, with an average price of $0.2529. If you invest $1,000 in Sei today and hold until March 15, 2027, you could see a potential profit of $1,711.96, reflecting a 171.20% ROI over the next 289 days. Investing $10,000 in Sei today and holding until March 15, 2027, could yield a potential profit of $17,123, which corresponds to a 171.23% ROI over the same period.
SEI coin price prediction 2028
The analysis suggests a further acceleration in SEI’s growth in 2028. According to the Cryptopolitan price forecast, it will trade between $0.3539 and $0.4261, with a year-round average of $0.3640.
SEI token price prediction 2029
Based on SEI’s price movements in 2029, the maximum price is $0.6199, the minimum is $0.5210, and the average is $0.5392.
SEI price prediction 2030
The SEI coin price prediction for 2030 suggests a price range of $0.7849 to $0.9054 and an expected average trading price of $0.8065. Some longer-term projections put the minimum SEI prices and recovery range at about $0.82 to $1.26 by 2030. The potential ROI by 2030 is also estimated at 320.7% for long-term investors. This long-term prediction also hinges on SEI’s rising global market recognition and adoption.
SEI prediction 2031
SEI forecast for 2031 sets the high at $1.37. On the lower side, it will drop to a low of $1.13, with an average price of $1.17. Another Sei price prediction for 2031 puts the minimum price at $0.09036 and the top of the range at $0.2791, implying a potential gain of 314.51%.
SEI price prediction 2032
Per expert predictions, the price of SEI will range between $1.66 and $2.02, with an average of $1.72.
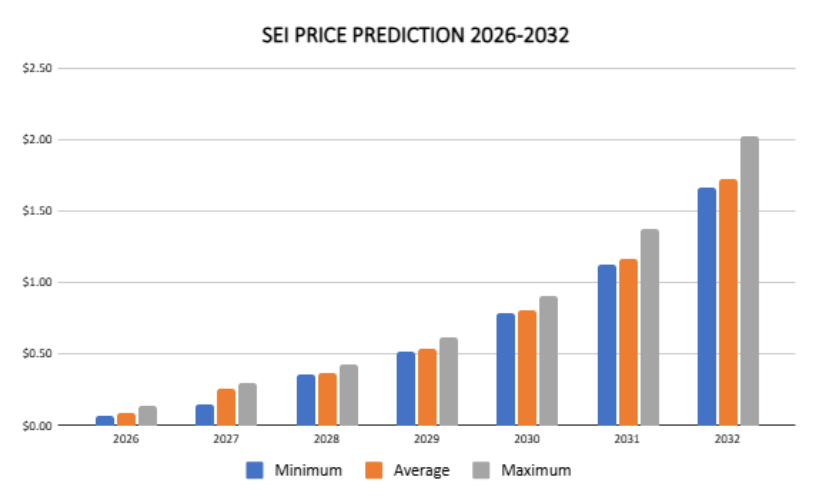
SEI price prediction 2026-2032
SEI market price prediction: Analysts’ SEI price forecast
| Firm | 2026 | 2027 | 2028 |
| Gate.com | $0.0595 | $0.07199 | $0.07883 |
| Coincodex | $0.04019 | $0.1024 | $0.06835 |
Cryptopolitan SEI price prediction
SEI key price levels are expected to rise in the coming years, according to price prediction tools. The coin will reach a high of $0.1378 before the end of 2026, though this prediction assumes only one scenario, as supply and demand shifts and real-world events such as hacks can quickly change the price of this asset. In 2028, it will range between $0.35 and $0.43, with an average of $0.36. However, SEI is still highly volatile. Negative market sentiment, such as market crashes, could derail the predictions. Always seek independent professional consultation for investment advice.
SEI historic price sentiment
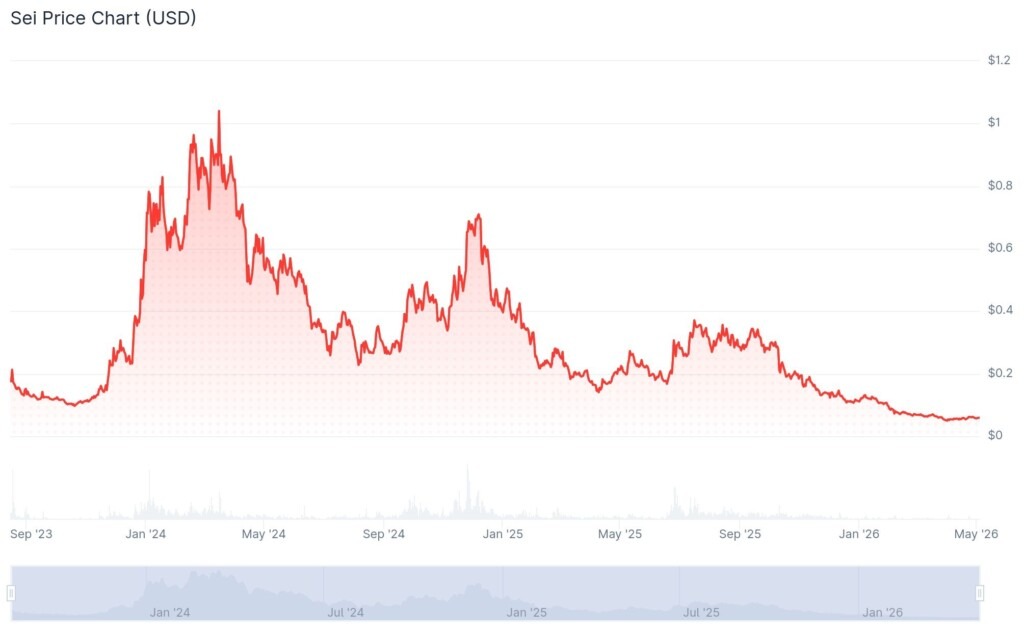
- The SEI network launched in August 2023, following the public beta’s launch. A community airdrop accompanied the launch.
- As per CoinMarketCap data, it started trading at $0.1808.
- Since listing, it has experienced significant fluctuations, reaching an all-time low of $0.007989 on August 15, 2023.
- The coin later reached an all-time high of $1.14 on Mar 16, 2024.
- Since March, it has been in a bear market, falling to $0.27 in September. It then started recovering and traded at $0.45 in October.
- It then started recovering in November; by December, it had risen above $0.68.
- It was later corrected and crossed into 2025, trading at $0.40, dropping to $0.32 in February. By March, it had fallen below $0.27.
- In June, it fell below $0.20. In December, it reached $0.13.
- Rapid changes in market capitalization have also contributed to sharp price swings in Sei over time.
- In February 2026, it fell below the $0.10 support level. By April and May, it had fallen below support at $0.06. In June, it traded at $0.05.


Read More


