Key takeaways:
- The Graph could reach a 2026 high of $0.0217 under the stated price forecast.
- GRT may trade between $0.0393 and $0.051 in 2028, averaging $0.0452.
- The 2032 forecast places GRT between $0.09 and $0.1297, with a $0.1035 average.
The Graph provides developers and data consumers with efficient access to decentralized blockchain data. Its network operates around the clock and reports 99.99% uptime. Subgraphs sit at the center of the protocol, serving as open APIs that organize, index, and deliver blockchain information.
The Graph supports more than 100 indexer nodes, has processed 1.23 trillion queries, and hosts over 70,000 projects. Its native GRT token rewards network participants for indexing data and making it available to users.
How high could GRT rise? Is The Graph a worthwhile investment, and what price could it reach in 2026? The following sections examine its outlook, forecasts, and key growth factors.
Overview
| Cryptocurrency | The Graph |
| Ticker | GRT |
| Current price | $0.0178 |
| Market cap | $191.49M |
| Trading volume (24-Hour) | $12.15M |
| Circulating supply | 10.89B GRT |
| All-time high | $2.88 Feb 12, 2021 (5y ago) |
| 24-hour high | $0.01792 |
| 24-hour low | $0.01753 |
The Graph price prediction: Technical analysis
| Metric | Value |
| Price Volatility (30-day variation) | 5.05% (High) |
| 50-day SMA | $ 0.02028 |
| 200-day SMA | $ 0.02678 |
| Fear and greed index | 22 (Extreme Fear) |
| Green days | 9/30 (30%) |
| Sentiment | Bearish |
The Graph price analysis
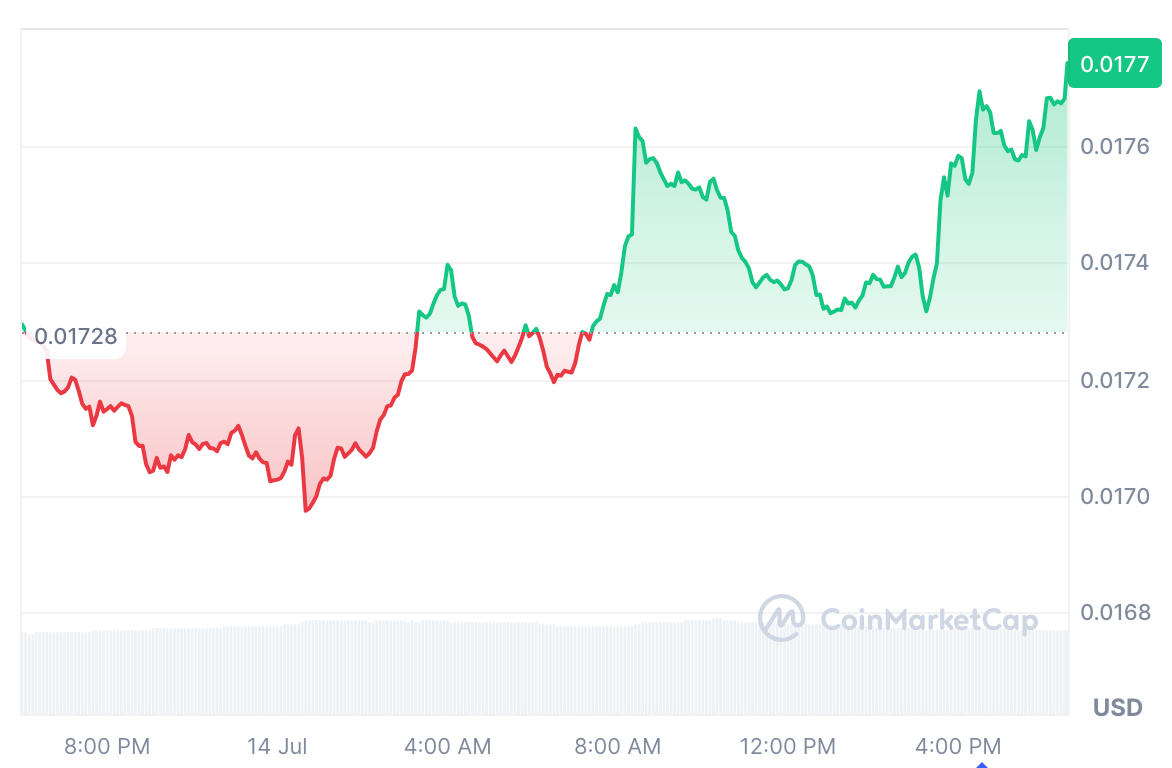
- GRT gains 1.36% over 24 hours and trades near the upper end of its daily range.
- Buyers defend the main support zone, while resistance near the session high limits further gains.
- The daily and four-hour structures show higher lows and a modest upward bias.
On 15 July 2026, The Graph (GRT) trades at $0.0178 after gaining 1.36% over the past 24 hours. The immediate support level is at $0.01753, and resistance is near the daily high price of $0.01792. Buyers are holding on to the gains, and the price is in the middle of this range.
The Graph 1-day chart analysis
The daily setup shows GRT attempting to establish a stable base after its early recovery. The token holds above its main support area, indicating that sellers have struggled to reverse the recent upward move.
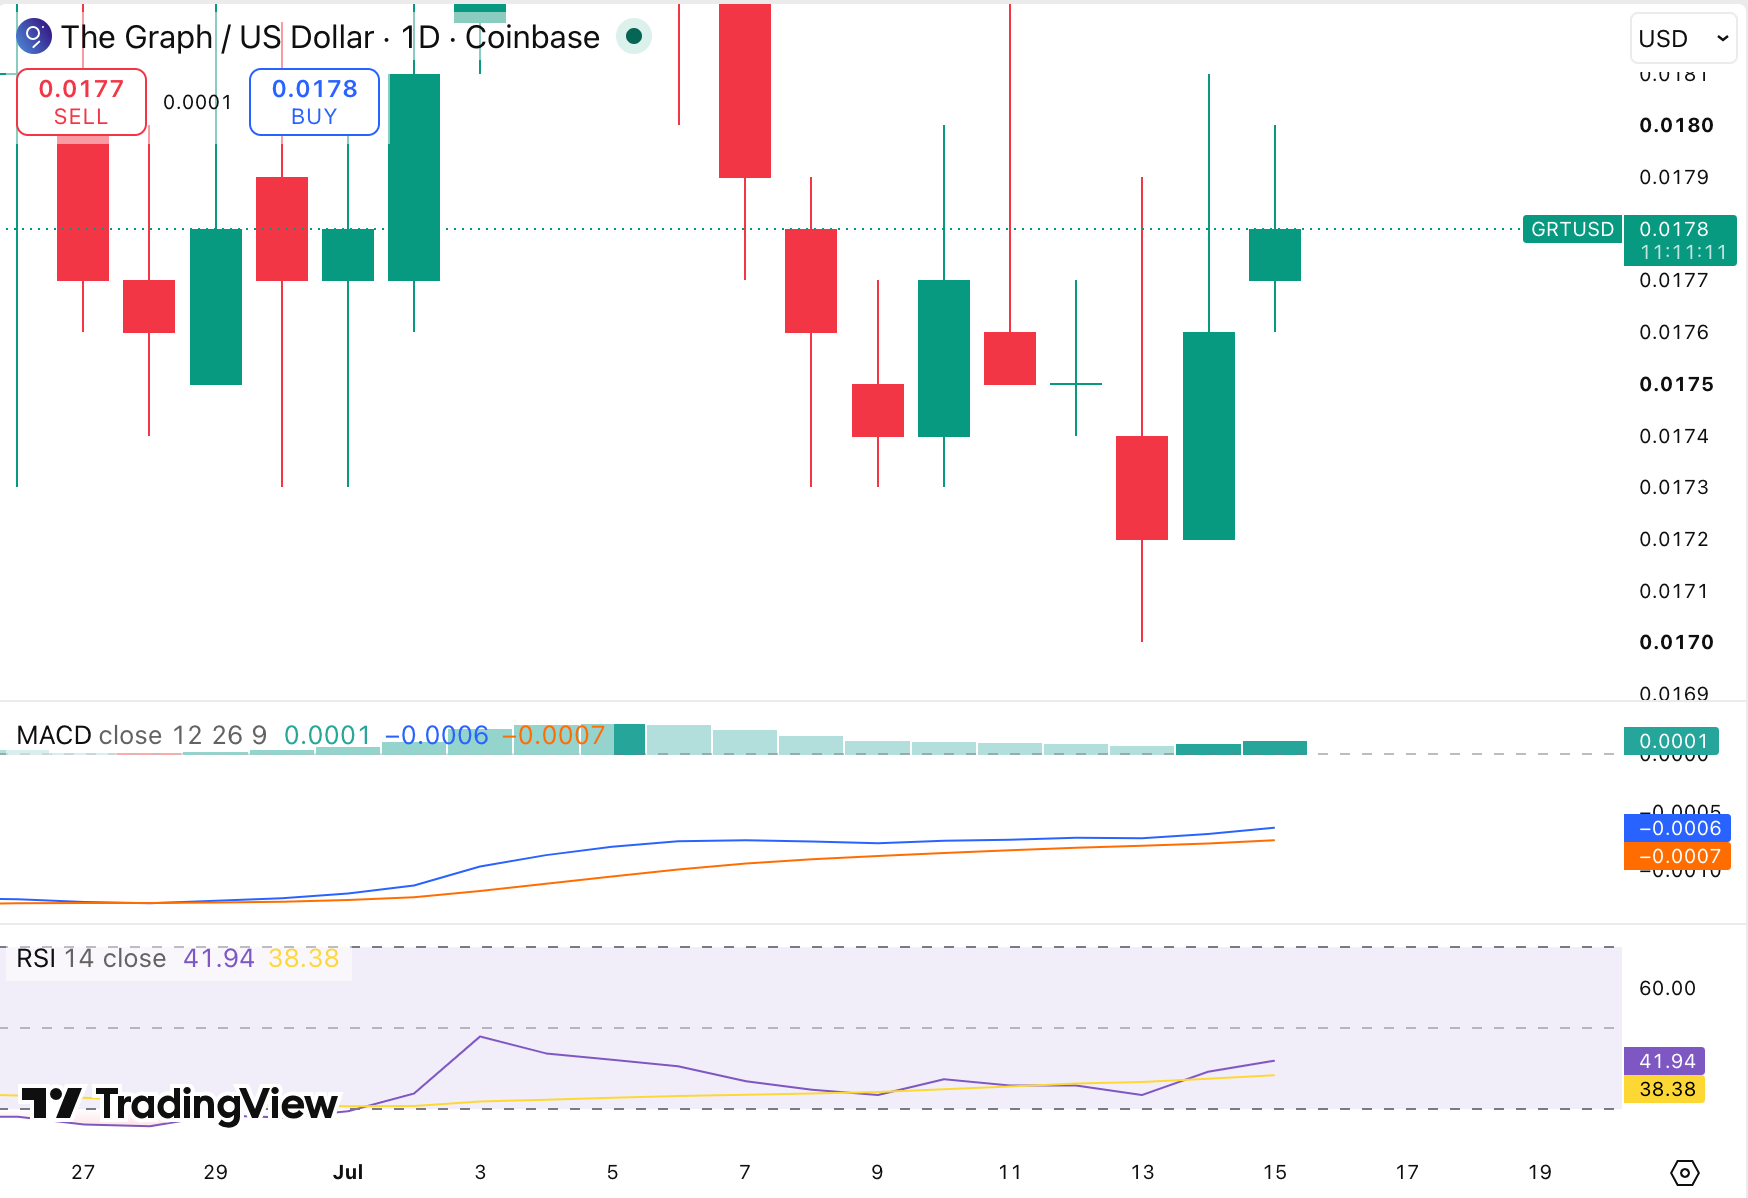
GRT is recovering from recent lows and trading at $0.0178 on the daily chart. The RSI is over the signal level of 38.38, and the level of 41.94 is showing momentum improving but below the neutral level of 50.
The Graph 4-hour chart analysis
The 4-hour chart is displaying a buying frenzy when GRT gets close to the short-term support zone. This is followed by rejections and a narrow trading pattern with a slight bias to the upside.
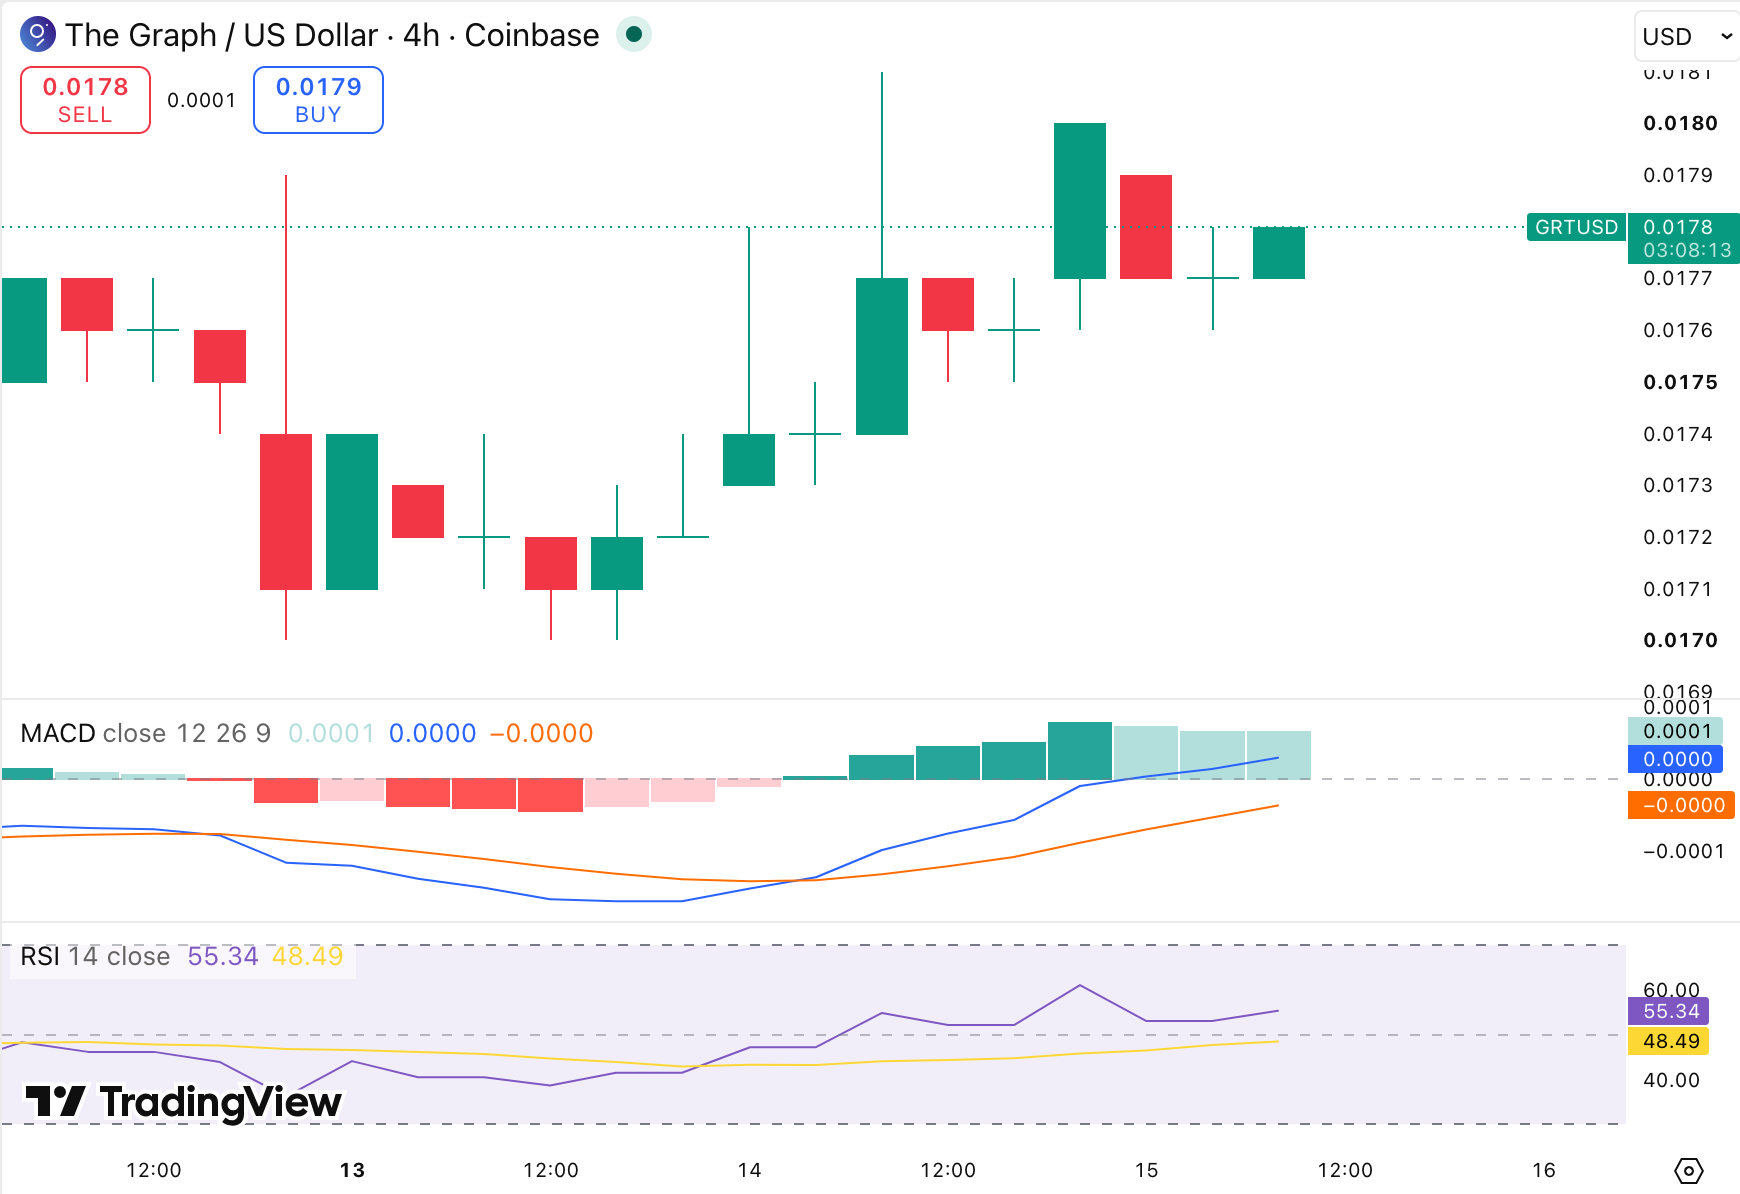
The four-hour time frame reveals bullish momentum as GRT continues to make higher lows and sustain recent gains. The RSI is at 55.34, which is still below its signal average of 48.49, though it is showing increased buying pressure, not yet overbought.
The Graph technical analysis: Levels and action
Daily simple moving average (SMA)
| Period | Value | Action |
| SMA 3 | $ 0.01740 | BUY |
| SMA 5 | $ 0.01746 | BUY |
| SMA 10 | $ 0.01786 | SELL |
| SMA 21 | $ 0.01801 | SELL |
| SMA 50 | $ 0.02028 | SELL |
| SMA 100 | $ 0.02282 | SELL |
| SMA 200 | $ 0.02678 | SELL |
Daily exponential moving average (EMA)
| Period | Value | Action |
| EMA 3 | $ 0.01735 | BUY |
| EMA 5 | $ 0.01747 | BUY |
| EMA 10 | $ 0.01772 | SELL |
| EMA 21 | $ 0.01824 | SELL |
| EMA 50 | $ 0.01996 | SELL |
| EMA 100 | $ 0.02268 | SELL |
| EMA 200 | $ 0.03093 | SELL |
What can we expect next in GRT price analysis?
GRT could retest the $0.01792 resistance level should buyers continue the prolonged upward formation. A prolonged period of consolidation may be followed by a move to $0.0180.If the consolidation is sustained, then a move to $0.0180 could be brewed. If resistance is not overcome, GRT might stay in a small range.
The price might then return to the $0.01753 support area. The daily time frame is yet to confirm the follow-through and the 4-hour time frame is indicating firm demand. As long as the bullish trend remains intact, holding support is the best scenario.
Why is GRT up?
GRT trends generally in tandem with the overall crypto market when U.S. inflation data is weaker, boosting demand for risk assets. Inflation in June climbs to 3.5% from last year, but decelerates slightly to 0.4% from the prior month, tempering immediate Federal Reserve rate-hike fears.
Bitcoin and some of the altcoins are rising, and a rotation of the altcoins in the second tier is supporting GRT. There is no significant catalyst to postpone the gain in this project, and the advance is mostly macro-driven.
Is The Graph a good investment?
The Graph competes with some Web2 data services through its efficient and low-cost infrastructure. However, its native GRT token remains exposed to broader market trends and sharp price swings.
Current market sentiment is bearish, although long-term forecasts suggest possible price growth. Investors should conduct independent research and assess the risks before entering the volatile cryptocurrency market.
Will GRT reach $0.1?
The Graph could trade near $0.0908 in 2031. Forecasts place GRT between $0.0798 and $0.117 during the year. Although this projected range suggests potential growth, investors should assess market risks before buying GRT.
Will GRT reach $1?
According to analysts’ forecasts, The Graph is unlikely to reach $1 by 2032.
Will GRT reach $10?
Considering GRT’s current price and market cap, it remains highly unlikely that it will reach $10 in the next ten years.
Does GRT have a good long-term future?
Market projections suggest GRT could trade higher in the coming years. Still, sharp market downturns or restrictive regulations may weaken this outlook. Investors should conduct thorough research and seek professional financial guidance before entering the volatile crypto market.
The Graph price prediction July 2026
The Graph must break above resistance to end its bearish trend this month. Current projections place GRT between $0.014 and $0.0215, with an average price of $0.0182.
| Month | Potential low | Potential average | Potential high |
| July | $0.014 | $0.0182 | $0.0215 |
GRT price prediction 2026
GRT could regain earlier price levels during the third quarter of 2026. Forecasts place the token between $0.009 and $0.0323, with an average price of $0.0212.
| Year | Potential low | Potential average | Potential high |
| 2026 | $0.009 | $0.0212 | $0.0323 |
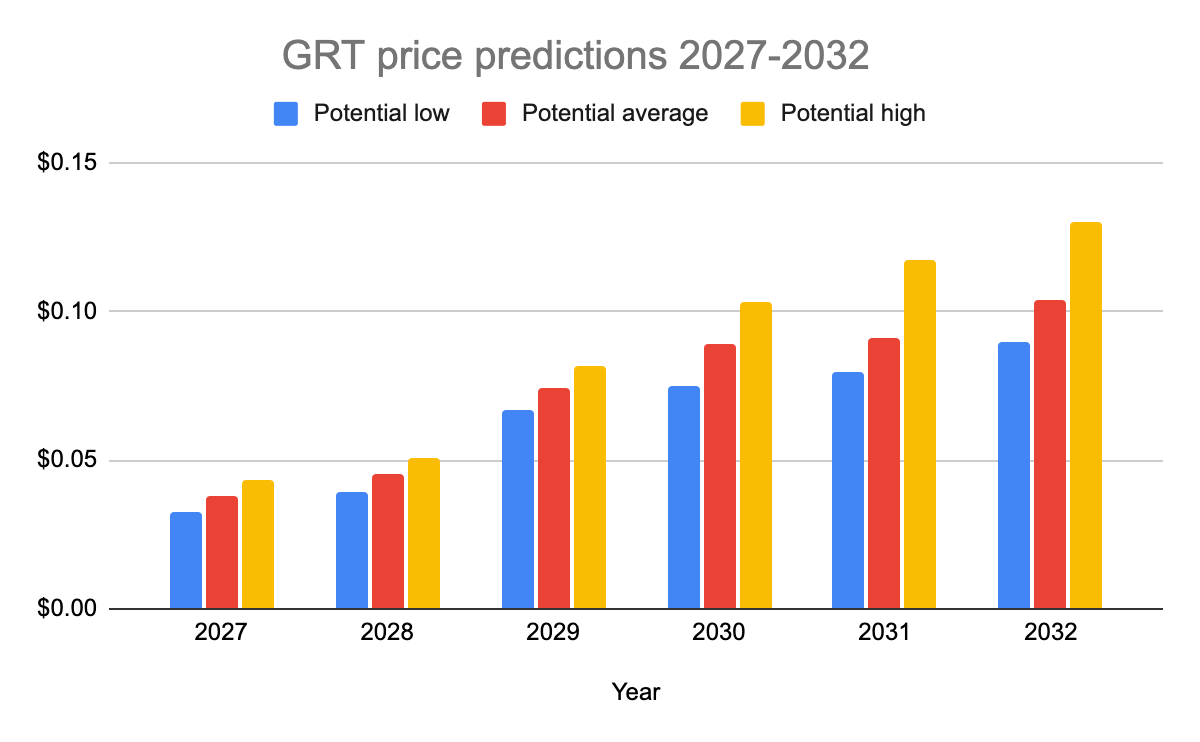
GRT price predictions 2027-2032
| Year | Potential low | Potential average | Potential high |
| 2027 | $0.0327 | $0.038 | $0.0433 |
| 2028 | $0.0393 | $0.0452 | $0.051 |
| 2029 | $0.0667 | $0.0741 | $0.0815 |
| 2030 | $0.0748 | $0.089 | $0.1033 |
| 2031 | $0.0798 | $0.0908 | $0.117 |
| 2032 | $0.09 | $0.1035 | $0.1297 |
The Graph price prediction 2028
The Graph could trade at a minimum price of $0.0327 in 2027. GRT may reach a high of $0.0433, with an average forecast price of $0.038.
The Graph price prediction 2028
The Graph could trade as low as $0.0393 in 2028. Forecasts place GRT’s maximum price at $0.051, with an average projected value of $0.0452.
The Graph price prediction 2029
The Graph could trade at a minimum price of $0.0667 in 2029. GRT may reach a high of $0.0815, with an average projected price of $0.07441.
The Graph price prediction 2030
Technical forecasts place The Graph’s minimum price at $0.0798 in 2030. GRT could reach a high of $0.1033, with an average trading price of $0.089.
The Graph price prediction 2031
The Graph could trade at a minimum price of $0.0798 in 2031. GRT may reach a high of $0.0117, with an average trading price of $0.0908.
The Graph price prediction 2032
Historical price analysis places The Graph’s minimum value at $0.09 in 2032. GRT could reach $0.1297, with an average trading price of $0.1035.
The Graph Market price prediction: Analysts’ GRT price forecast
| Platform | 2026 | 2027 |
| DigitalCoinPrice | $0.0257 | $0.0341 |
| CoinCodex | $0.0298 | $0.0411 |
Cryptopolitan’s GRT price prediction
GRT could reach $0.0545 during the second half of 2026. Forecasts place the token between $0.0327 and $0.0433 in 2027, averaging $0.038. By 2032, GRT may trade between $0.09 and $0.1297, with an average price of $0.1035. These projections do not constitute investment advice. Investors should conduct independent research or consult a qualified financial professional.
The Graph historic price sentiment
- Yaniv Tal, Brandon Ramirez, and Jennus Pohlman launched The Graph on the Ethereum blockchain in 2018.
- In June 2020, The Graph held its private token sale, raising $5 million. Some participants included Multicoin Capital, Digital Currency Group, and DTC Capital.
- The public sale, which took place in October 2020, raised $12 million. Each token sold for $0.03. The mainnet launched in December 2020.
- In January 2021, another sale led by Tiger Global Management raised $50 million.
- Looking back, GRT had its best performance in 2021, when it registered its all-time high at $2.88 on February 12, 2021, as per crypto market data.
- In Feb 2022, venture capital firms DCG, Multicoin Capital, NGC Ventures, Gumi Cryptos Capital, and Hashkey announced the launch of a $205 million ecosystem fund, The Graph Protocol.
- In preceding years, GRT consistently traded below $0.7. According to historical data, in 2023, it fell below $0.2.
- In 2024, GRT reached a high of $0.45 in March before falling below $0.20 in July and dipping to $0.1280 in August, with a brief spike to $0.1767. After a gradual decline, it closed at $0.1470 by October.
- Recovery followed, with GRT climbing to $0.281 in November and peaking at $0.337 in December before ending the year at $0.198.
- At the start of January 2025, GRT was trading at $0.23, which decreased to $0.13 in February.
- In March, the price of GRT triggered a decline and touched the ground below $0.09.
- By the end of April, the GRT price recovered toward the crucial $0.1 mark, while in the first half of May, GRT touched $0.127 while surging to $0.132 when the market sentiment was bullish.
- In June, GRT touched the lowest point of $0.0695, and in July 2025, GRT saw a high of $0.1210.
- In October, GRT once again plunged below $1, reaching $0.088, and at the start of November, GRT was trending near $0.057. In December, the token plummeted to the $0.046 range as market sentiment turned negative.
- At the start of January 2026, GRT was maintaining the $0.04 range, and in March, it slipped to $0.0255, as market sentiment turned bearish.
- In April, GRT was trending near the $0.024 range, and in May, it slightly increased to $0.028, while in June it plunged to $0.019
- GRT has historically shown mixed price action in July, with periods of recovery often followed by renewed selling pressure.
- July trading has typically reflected broader crypto market sentiment, producing sharp swings and limited directional consistency.


Read More