


The post Why Bitcoin Is Down Today: Liquidation Heatmap Reveals Hidden Risk Zones Below $105K appeared first on Coinpedia Fintech News
Bitcoin is making a buzz again, but not for the reasons bulls had hoped. Over the past day, BTC’s price slid 4.53% to $105,606.24, and a daunting 12.73% over the past week. The market cap shrank 4.48% to $2.1 trillion, and trading volume soared 35% to $95.31 billion. What’s driving this sudden sell-off? It’s a mix of institutional moves, macroeconomic anxieties, and technical blockages that set the stage for a harsh drop.
First, $536 million poured out of U.S. spot Bitcoin ETFs as key funds slashed exposure. Geopolitics haven’t helped either. But the real tipping point came from the chart, as BTC crashed through $110,000. All eyes are now on whether Bitcoin can hold above the critical swing low of $104,582 from September or if we’re on the edge of a deeper slump.
Bitcoin Liquidation HeatMap
The liquidation landscape by CoinGlass reveals just how vulnerable Bitcoin is in this climate. Looking at the Bitcoin Liquidation HeatMap, you can see heavy clusters of liquidation leverage stretching from $109,000 down to the $105,000 area. The map flashes sudden bright bands, this is where leveraged positions are forced to unwind.
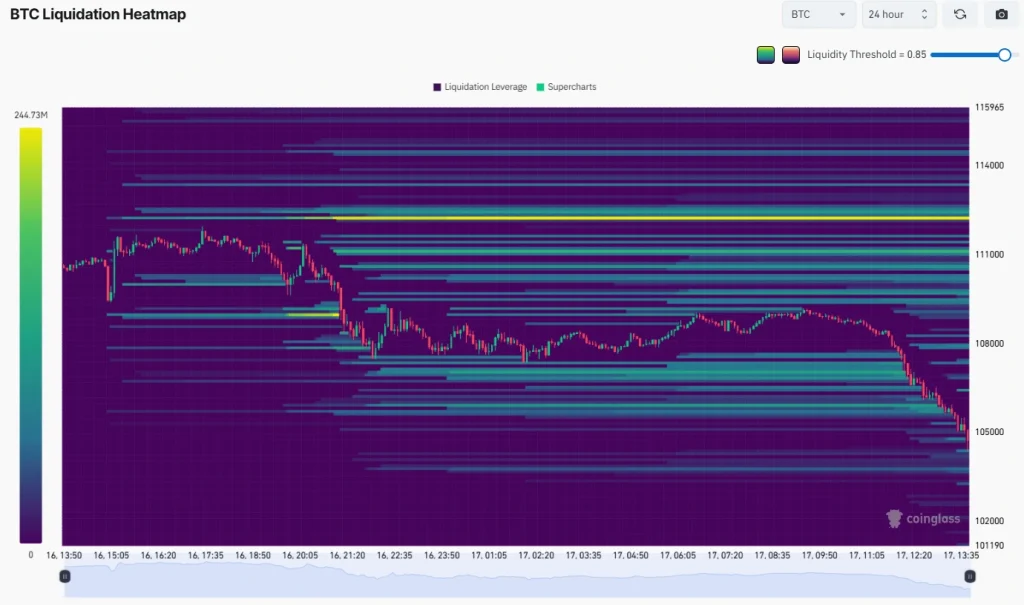
If BTC continues dipping and cracks below $104,582, things could get rapidly chaotic. The liquidation pressure shown in green and yellow bands signals pockets where traders are most exposed. Especially those using high leverage in hopes of a rebound. Right now, the HeatMap is a warning that further drops could see cascading liquidations if sentiment doesn’t stabilize.
BTC Price Analysis
Technically, the Bitcoin price is staggered. The breach below the 200-day SMA at $107,535 and the Fibonacci support at $109,208 triggered a burst of algorithmic selling. This is with price now hovering dangerously close to the September swing low of $104,582. The RSI at 37 shows BTC in oversold territory, and the MACD histogram at -1,339 paints an even bearish picture.
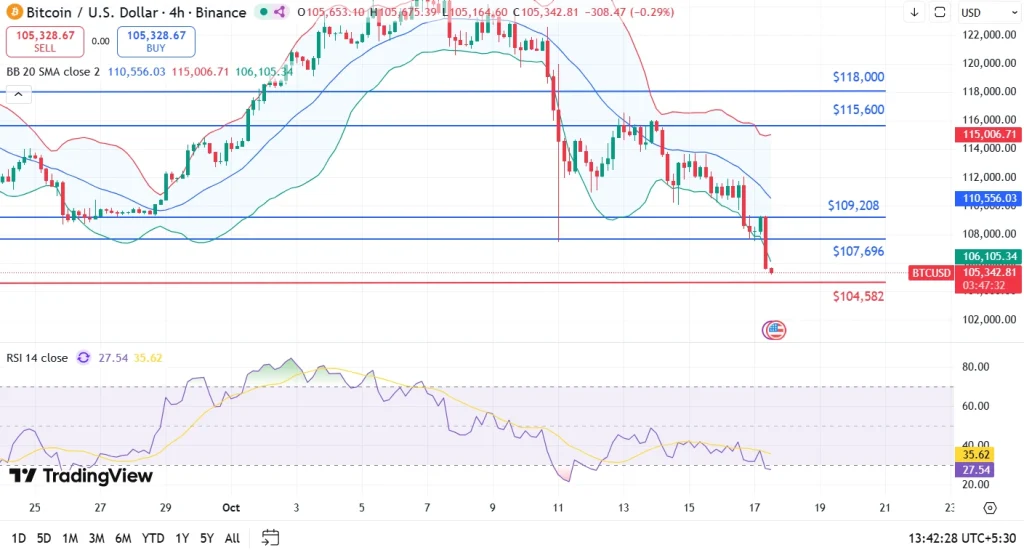
If sellers lose grip and BTC falls below $104,582, we could see panic selling trigger a further drop. Potentially opening the door to sub-$100,000 levels, especially if liquidation bands intensify. On the upside, first resistance sits at $107,696, then a tougher zone at $109,208.
FAQ
BTC is plunging due to heavy ETF outflows, global macro risks, and a breakdown of key technical levels, triggering algorithmic orders and panic-driven liquidation.
The Liquidation HeatMap tracks clusters where highly leveraged positions are vulnerable. If price hits these zones, forced liquidations spike, causing accelerated selling and sharp price moves.
Immediate support sits at $104,582, with major resistance at $107,696 and $109,208.
The post Why Bitcoin Is Down Today: Liquidation Heatmap Reveals Hidden Risk Zones Below $105K appeared first on Coinpedia.org.


Read More