


The post XRP ‘Opportunity Zone’ Is Here, But Chart Still Lacks Breakout Confirmation—Here’s What’s Next appeared first on Coinpedia Fintech News
The XRP price is showing early signs of a potential bottoming phase, but the market isn’t confirming it yet. The token is currently trading around $1.31, holding near key support after a weak bounce, while recent sessions have seen muted price action and inconsistent volume follow-through. At the same time, on-chain data paints a more compelling picture: the average trader returns have dropped to -41%, the lowest level since the FTX collapse.
While such extreme losses have historically marked accumulation zones, the XRP price remains stuck in a downtrend, leaving traders split between value and confirmation.
XRP MVRV Hits Extreme Lows — But Timing Remains Unclear
Santiment data shows XRP’s 365-day MVRV dropping to around -41%, placing it deep within what is historically considered an “opportunity zone.” This means the average holder over the past year is sitting on significant losses — a condition that typically emerges during late-stage corrections or capitulation phases.
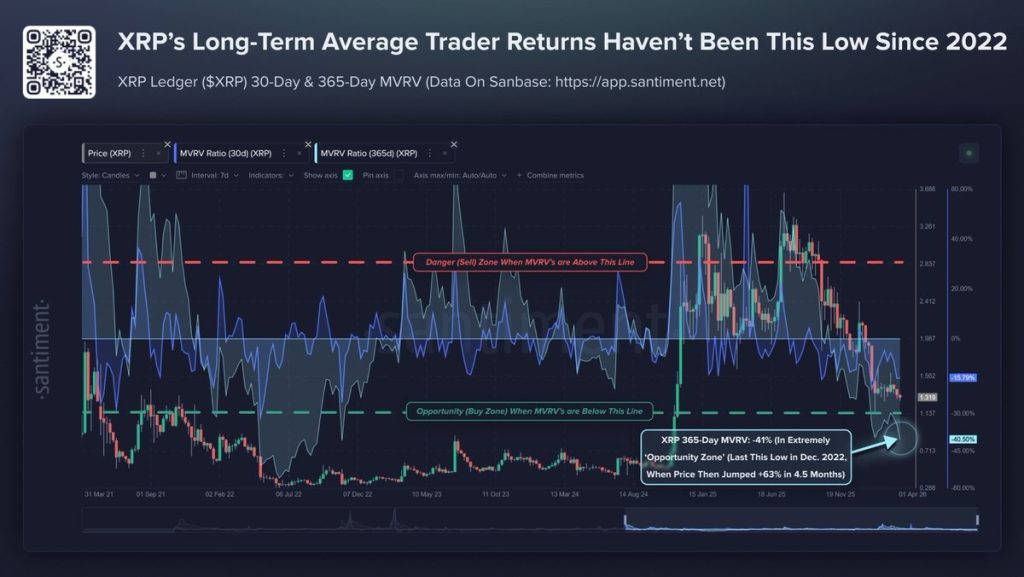
At the same time, the chart highlights a clear pattern: whenever MVRV moves below this threshold, downside risk tends to compress as selling pressure weakens. The last time XRP entered a similar zone during the FTX collapse, the price eventually rebounded by over 60% in the following months.
However, not all signals are immediately actionable. The 30-day MVRV remains closer to neutral, indicating that short-term traders are not yet deeply underwater—a key condition often seen before stronger reversals. This creates a mixed setup where long-term value is emerging, but short-term conviction is still lacking.
XRP Price Analysis: Downtrend Remains Intact as Key Breakout Still Missing
Despite improving long-term valuation signals, XRP’s price action continues to reflect weakness. On the 4-hour chart, the asset remains confined within a descending channel, with price currently trading near $1.31 after facing rejection near the upper boundary. The structure remains clearly bearish as lower highs continue to form below the $1.34 to $1.36 range.
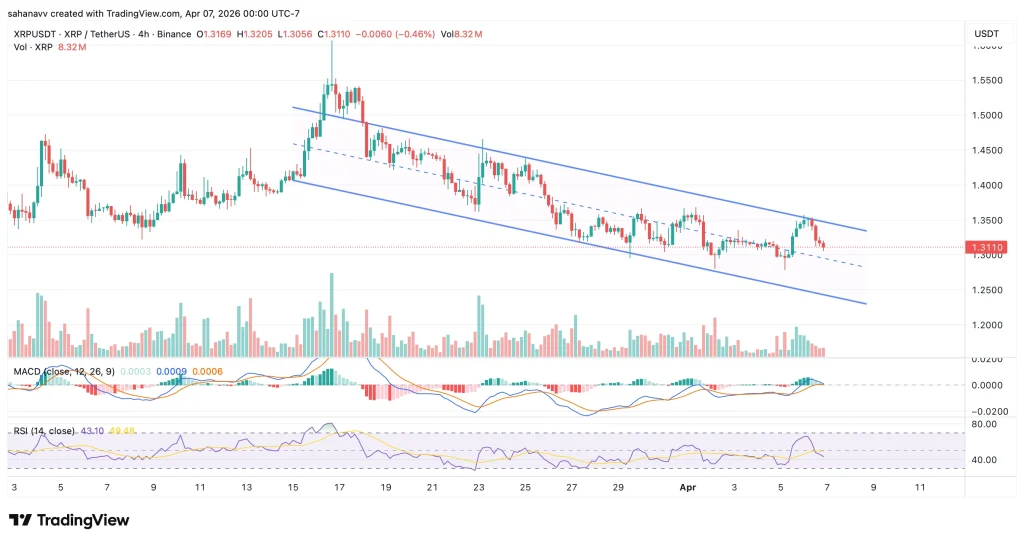
The price is struggling to build momentum above the mid-range of the descending parallel channel. Therefore, the broader trend remains downward unless a breakout occurs. Besides, the RSI is holding around 43 to 49, indicating neutral to weak strength, while the MACD is showing a mild bullish crossover attempt but flattening, which is a sign of fading momentum. Volume also fails to support a sustained move higher, suggesting that recent bounces lack stronger buyer conviction.
The Bottom Line
The XRP Price is currently caught in a classic market conflict, with the on-chain signals showing deep undervaluation within an accumulation zone, while the price structure is bearish with no confirmation. A breakout above $1.36 could shift short-term structure, opening upside toward $1.45 to $1.55. Failure to break resistance and a loss of $1.30 support would likely extend downside toward $1.25 to $1.20.
XRP is entering a historically attractive accumulation zone, with long-term holders already deep in losses — a condition that has previously preceded strong recoveries. However, price action has yet to validate this shift. Until XRP breaks out of its descending channel and reclaims $1.36, the market remains structurally weak.
The post XRP ‘Opportunity Zone’ Is Here, But Chart Still Lacks Breakout Confirmation—Here’s What’s Next appeared first on Coinpedia.org.


Read More